
Figure 1.
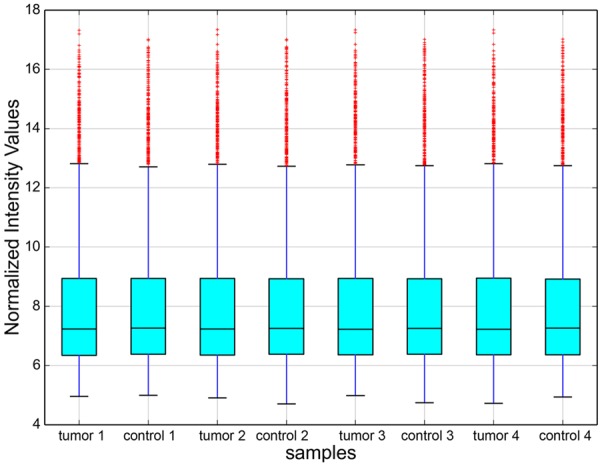
Box plot. X-axis: 8 tissue samples; Y-axis: normalized intensity values. All the 8 samples in the databases were normalized. The distribution of circRNAs was almost similar in all samples.
Official websites use .gov
A
.gov website belongs to an official
government organization in the United States.
Secure .gov websites use HTTPS
A lock (
) or https:// means you've safely
connected to the .gov website. Share sensitive
information only on official, secure websites.
Box plot. X-axis: 8 tissue samples; Y-axis: normalized intensity values. All the 8 samples in the databases were normalized. The distribution of circRNAs was almost similar in all samples.