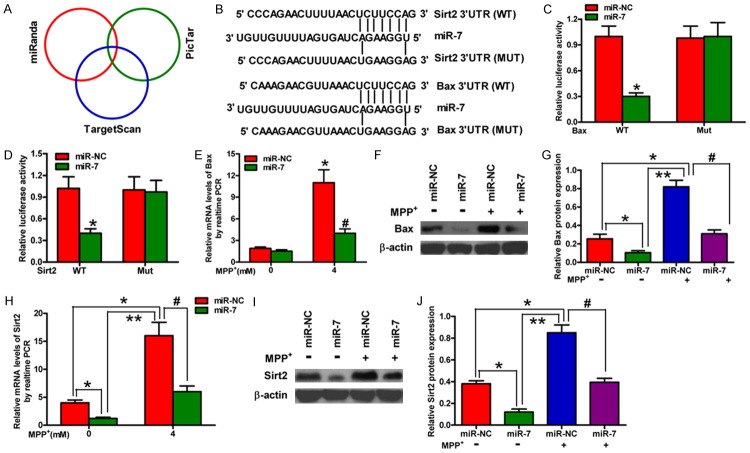
Figure 3.
Bax and Sirt2 are the direct targets of miR-7. (A) The potential targets of miR-7 were predicted by integrating the results of three algorithms (TargetScan, PicTar, and miRanda). (B) The predicted binding sites of miR-7 in the 3’-UTR of Bax (upper) and Sirt2 (bottom). (C, D) The results of luciferase reporter assays performed at 24 h after co-transfection of SH-SY5Y cells with a pGL3 construct containing the WT or MUT Bax 3’-UTR region (C) or the WT or MUT Sirt2 3’-UTR region and miR-7 mimics (D). Data were normalized to those from cells co-transfected with pGL3 and miR-NC. (E, F) qPCR (E) and Western blot (F) analyses of Bax expression in mock-treated or MPP+-treated SH-SY5Y cells transfected with miR-7 or miR-NC mimics. (G) Relative protein band densities of Bax. (H, I) qPCR (H) and Western blot (I) analyses of Sirt2 expression in mock-treated or MPP+-treated SH-SY5Y cells transfected with miR-7 or miR-NC mimics. (J) Relative protein band densities of Sirt2. (E-J) The Bax and Sirt2 mRNA levels were normalized to that of GAPDH, and the Bax and Sirt2 protein levels were normalized to that of β-actin. Representative Western blots are shown. Data are represented as the mean ± SD of three replicates. *P< 0.05, #P< 0.05, and **P< 0.01.

