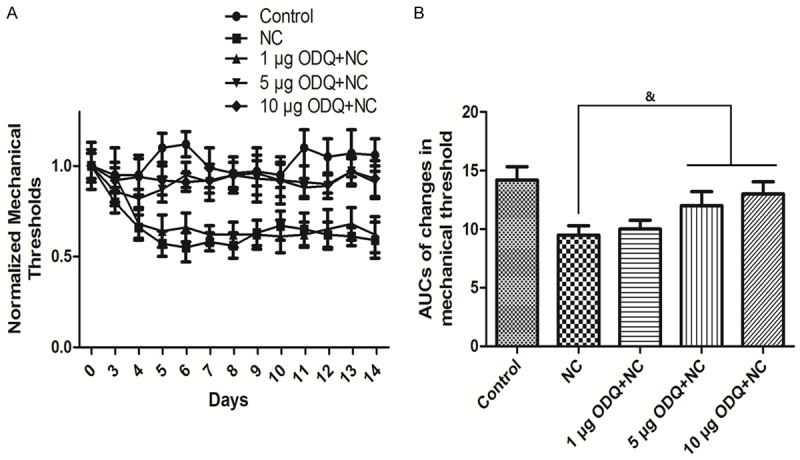
Figure 2.

Time course of changes in mechanical threshold when treated with sGC inhibitor and their AUCs. Time course of changes in mechanical threshold is shown in A. Quantification of optical densities is shown in B. Values are expressed as the Mean ± S.E.M. &p<0.05 compared to the NC group.
