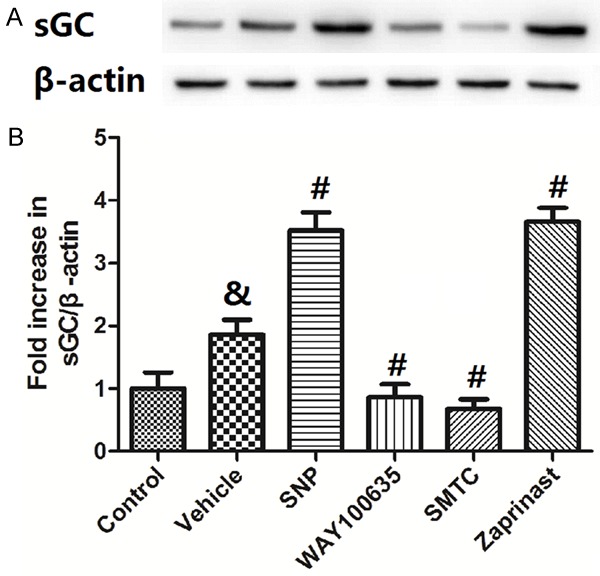
Figure 6.

Protein levels of sGC in the spinal cord with treatments of NO donor or inhibition of 5-HT1ARs, nNOS or Zaprinast. Representive sGC bands from Western Blot experiments are shown in A. Quantification of optical densities was shown B. Values are expressed as the Mean ± S.E.M. &p<0.05 compared to the Control group; #p<0.05 compared to the Vehicle group.
