
Figure 1.
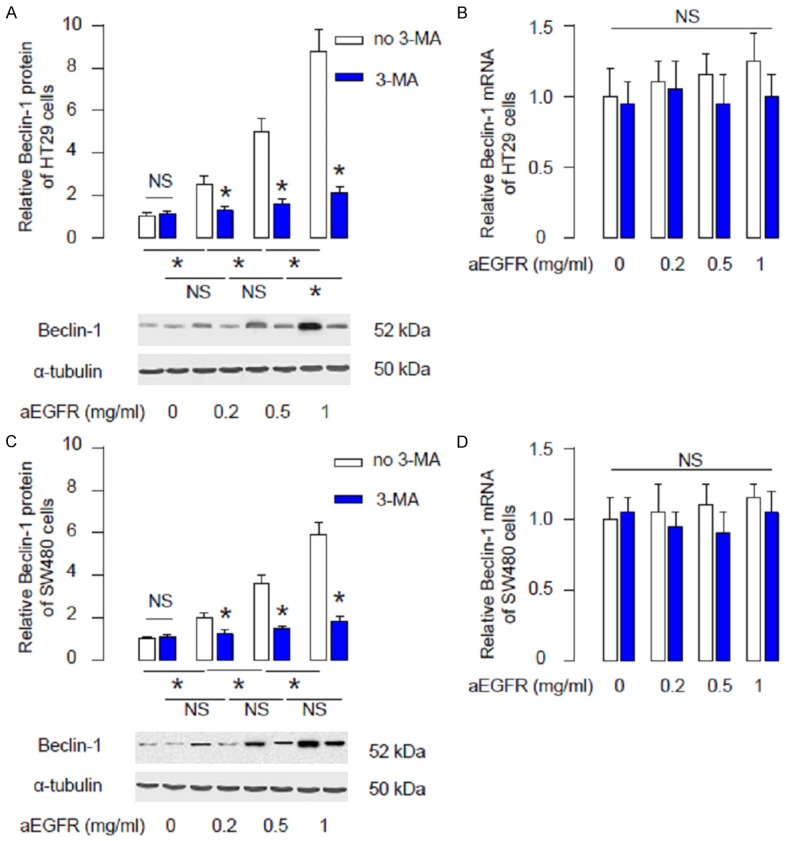
aEGFR dose-dependently increases Beclin-1 levels in CRC cells. (A, B) Beclin-1 levels in HT29 cells after aEGFR treatment (0.2 mg/ml, 0.5 mg/ml and 1 mg/ml) with/without 3-MA (5 mmol/l), shown by representative Western blots (A), and by RT-qPCR for mRNA (B). (C, D) Beclin-1 levels in SW480 cells after aEGFR treatment (0.2 mg/ml, 0.5 mg/ml and 1 mg/ml) with/without 3-MA (5 mmol/l), shown by representative Western blots (C), and by RT-qPCR for mRNA (D). *p<0.05. NS: non-significant. N=5.