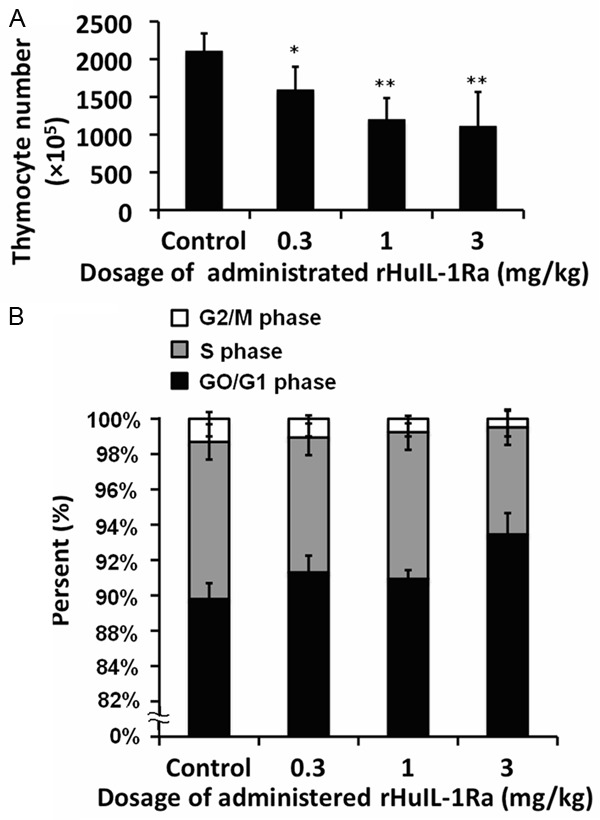
Figure 2.

Examination of the thymocyte population and the cell cycle status of thymocytes when treated with rHuIL-1Ra. A. The thymocyte number was counted when administrated with different dosage of rHuIL-1Ra. B. Proportion of G2/M-phase, S phase and G0/G1 phase of thymocytes when administrated with different dosage of rHuIL-1Ra. **P<0.01 and *P<0.05 represents the thymocytes number in different dosage of rHuIL-1Ra administration compared to the control group.
