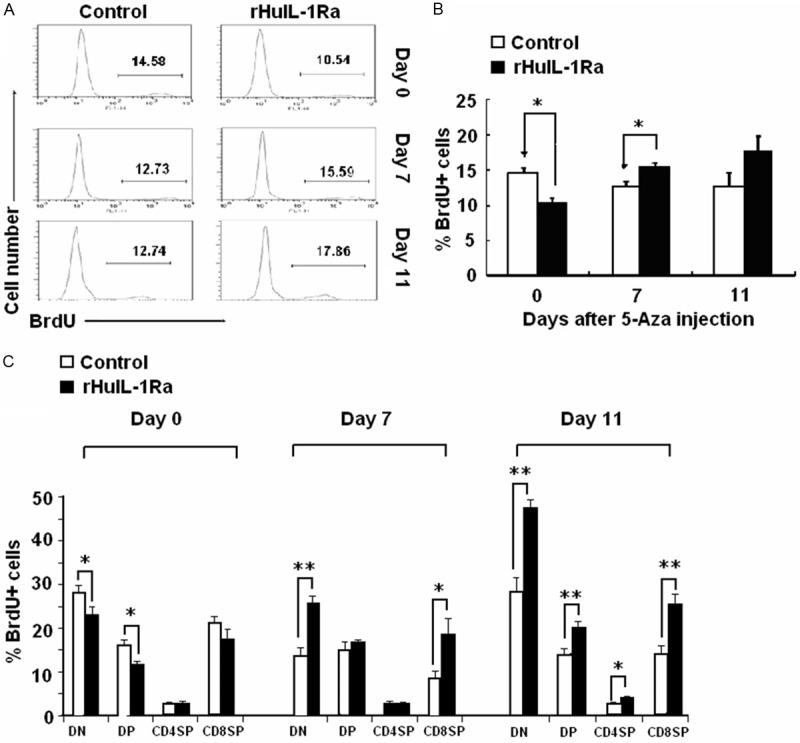
Figure 4.

BrdU+ thymocytes amounts and BrdU+ cells proportion in DN, DP, CD4SP and CD4SP in rHuIL-1Ra treated mice. The percentage of BrdU+ thymocytes in rHuIL-1Ra treated mice was examined by using flow cytometry assay (A), and was analyzed (B). (C) Examination for the proportion of BrdU+ cells in DN, DP, CD4SP and CD8SP in rHuIL-1Ra treated mice and in control mice. *P<0.05, **P<0.01 represent the values between the group marked with the arrow bar in graphs.
