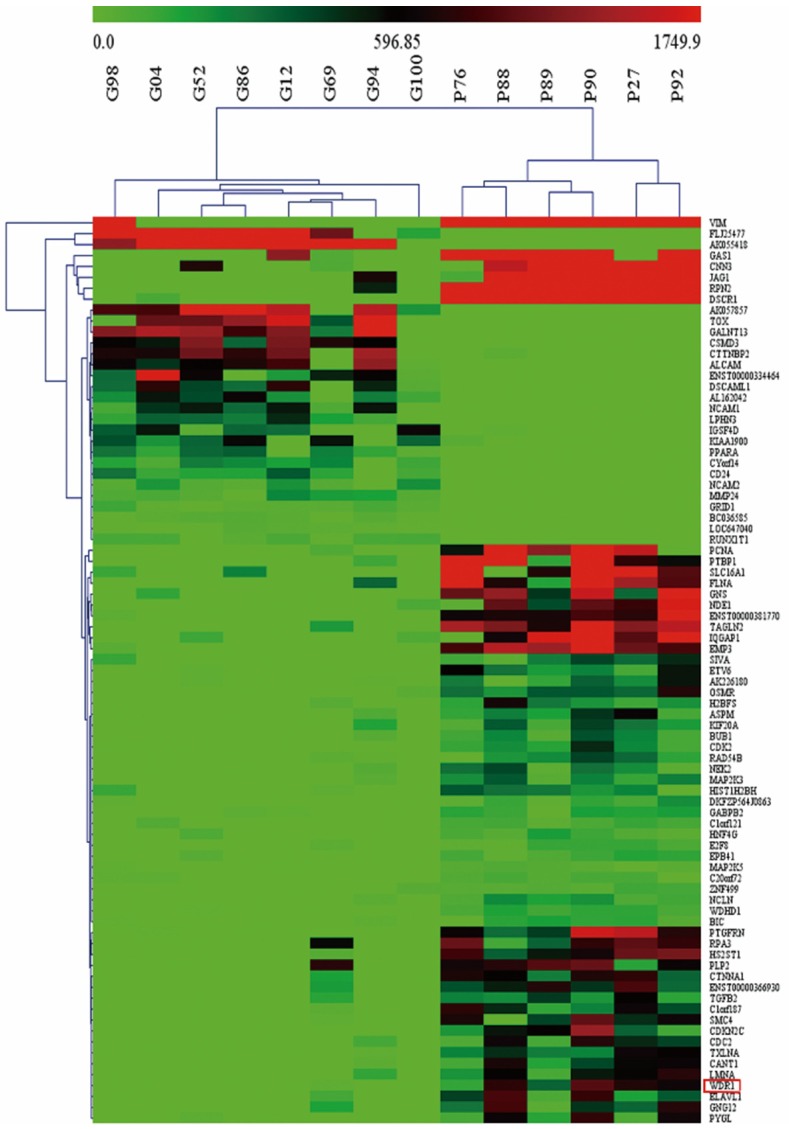
Figure 1.

WDR1 is included in a gene set differentiating 14 gliomas with different prognoses by hierarchal cluster analysis. The cutoffs of fold change ≥2 and t-test p<0.001 based on expression profile data by Affymetrix microarrays were used to screen differently expressed genes between “Good” and “Poor” groups. 83 genes were filtered out and associated with the prognosis of glioma patient. As shown in the heat map, each column represents a tumor sample and each row is for a single gene. And color bar indicates gene with expression intensity, high level of mRNA is shown in red and low level is shown in green. WDR1 is highlighted by a red box, which is upregulated in the “Poor” group comparing to the “Good”.
