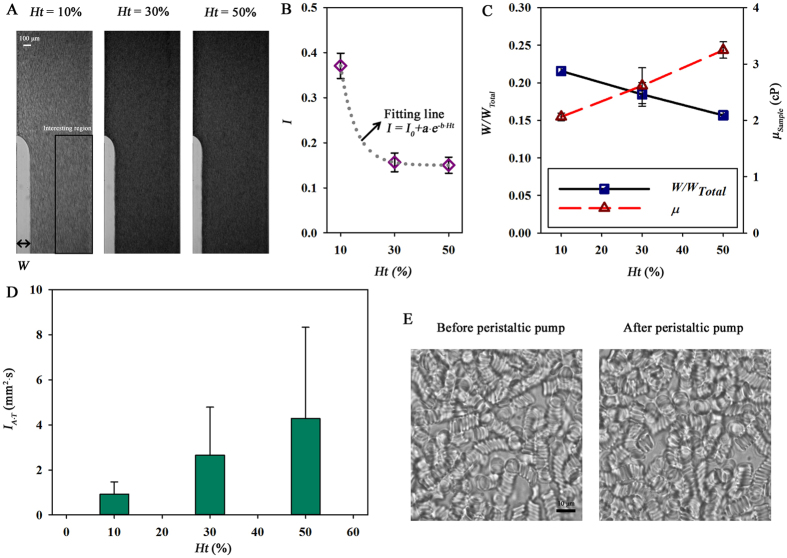
Figure 4. Variations in platelet adhesion and blood viscosity according to hematocrit (Ht).
(A) Flow images of blood samples with three different Ht levels (Ht = 10%, 30%, and 50%). The interfacial line between PBS solution and blood samples is clearly shown by closing the outlet of PBS flow. (B) Variation in image intensity (I) according to Ht. I is obtained by averaging image intensity in the ROI (half of the downstream side channel). A fitting curve is overlapped with the data points. (C) Variations in the normalized interfacial width (W/WTotal) and viscosity of blood sample (μSample) according to Ht. (D) Quantitative variation in the representative index that estimates platelet adhesion (IA·T) with regard to Ht. (E) Microscopic images of blood samples before and after passing through the peristaltic pump. Each data set is obtained from three samples.

