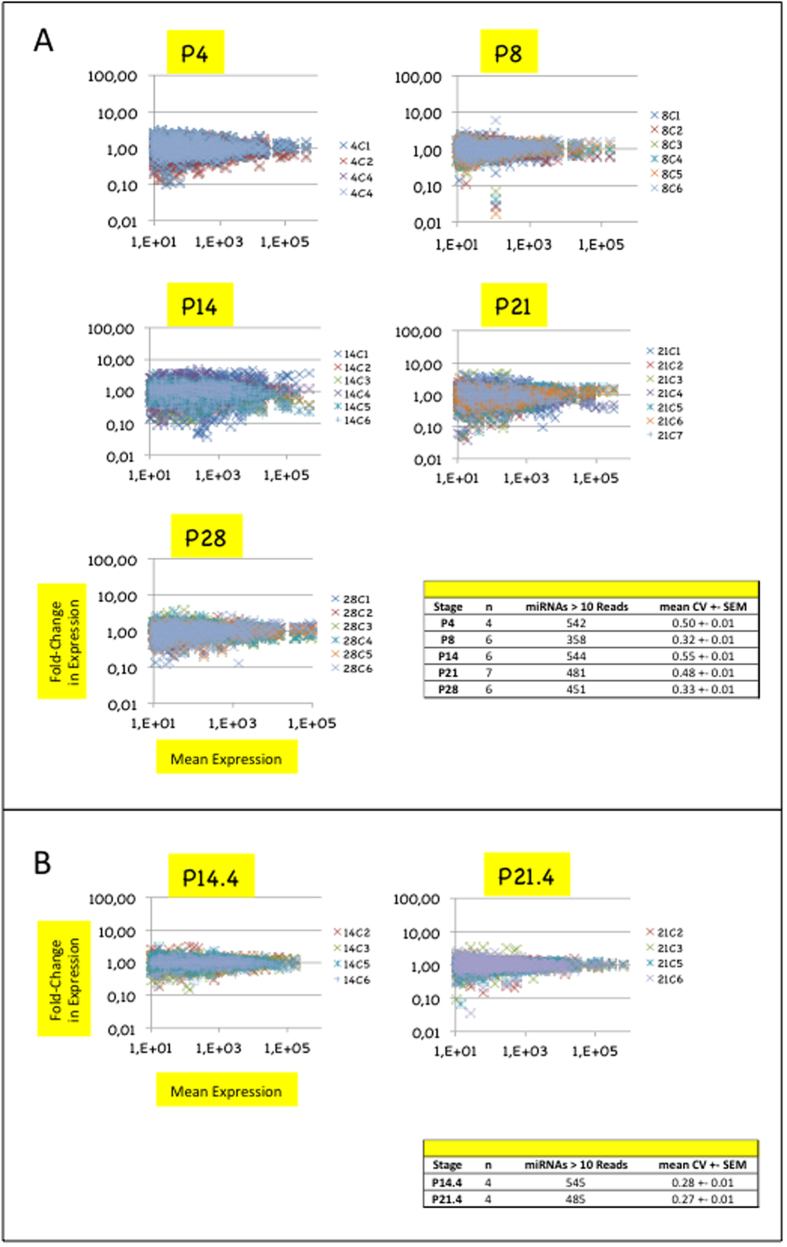
Figure 1. Differences in miRNA expression homogeneity across biological replicates suggest higher dynamics of miRNA expression in hypothalamic ARC/ME at stages P14 and P21.
(A) Plots depict miRNA relative expressions of ARC/ME at P4, P8, P14, P21 or P28. Stages are indicated above each plot. In each plot, the X-axis denotes mean read counts between biological replicates, the Y-axis, fold changes of expression relatively to the mean expression. Only miRNAs identified by >10 reads are shown. X- and Y-axes are drawn using a log(10) scale. Each dot represents the relative expression of an individual miRNA expression and each color, a biological replicate. Dots of positive or negative values on the Y-axis denote up- or down-regulated miRNA expressions relatively to mean expressions, respectively. Values on the Y-axis close to 1 denote miRNAs of highly homogeneous expression. Note that many Y-values were distant from 1 for miRNAs of low mean expression. This accounted for the fact that the lower the mean expression, the less precise its quantification. Coefficients of variations (standard deviation/mean; CV) were calculated for each miRNA (see Supplemental Table S2), and global CV (mean +/SEM), for each stage. Table in bottom right corner summarizes data for each stage. (B) Sub-stages P14.4 and P21.4 could be identified at stages P14 and P21, respectively.

