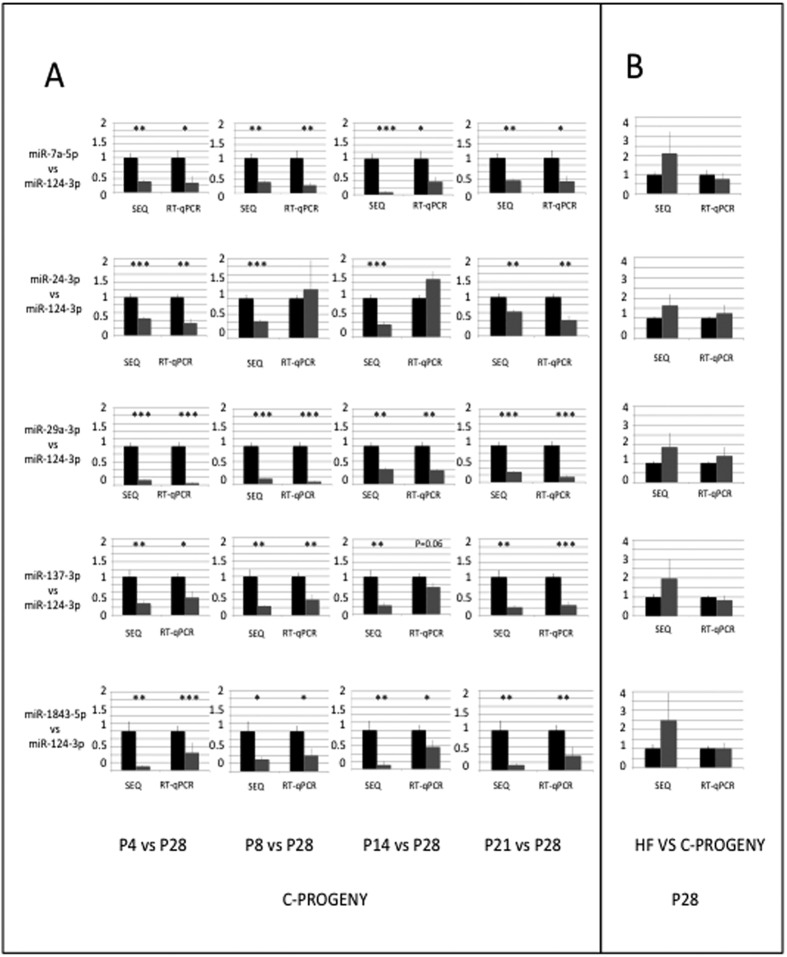
Figure 3. RTqPCR versus sequencing quantification of miRNA expression.
(A) Ratios of miR-7a-5p, miR-24-3p, miR-29-3p, miR-137-3p and miR-1843-5p expression to miR-124-3p expression at P4, P8, P14.4 and P21.4 were compared to ratios at P28 using data recovered from HTS or RT-qPCR technologies. Data are organized in lines (one miRNA/line) and columns (one stage/column). The reference ratio of 1 at P28 is shown as black bars while ratios at P4, P8, P14.4, P21.3 and P21.4 are shown as grey bars. p-values < 0.05, 0.01 and 0.001 are identified by *,** and *** symbols, respectively. All data are expressed as mean +/− SEM. (B) Ratios of miR-7a-5p, miR-24-3p, miR-29-3p, miR-137-3p and miR-1843-5p expression to miR-124-3p expression were calculated at P28 for progeny born to dams fed a balanced diet and compared to those of progeny born to dams fed an unbalanced diet.

