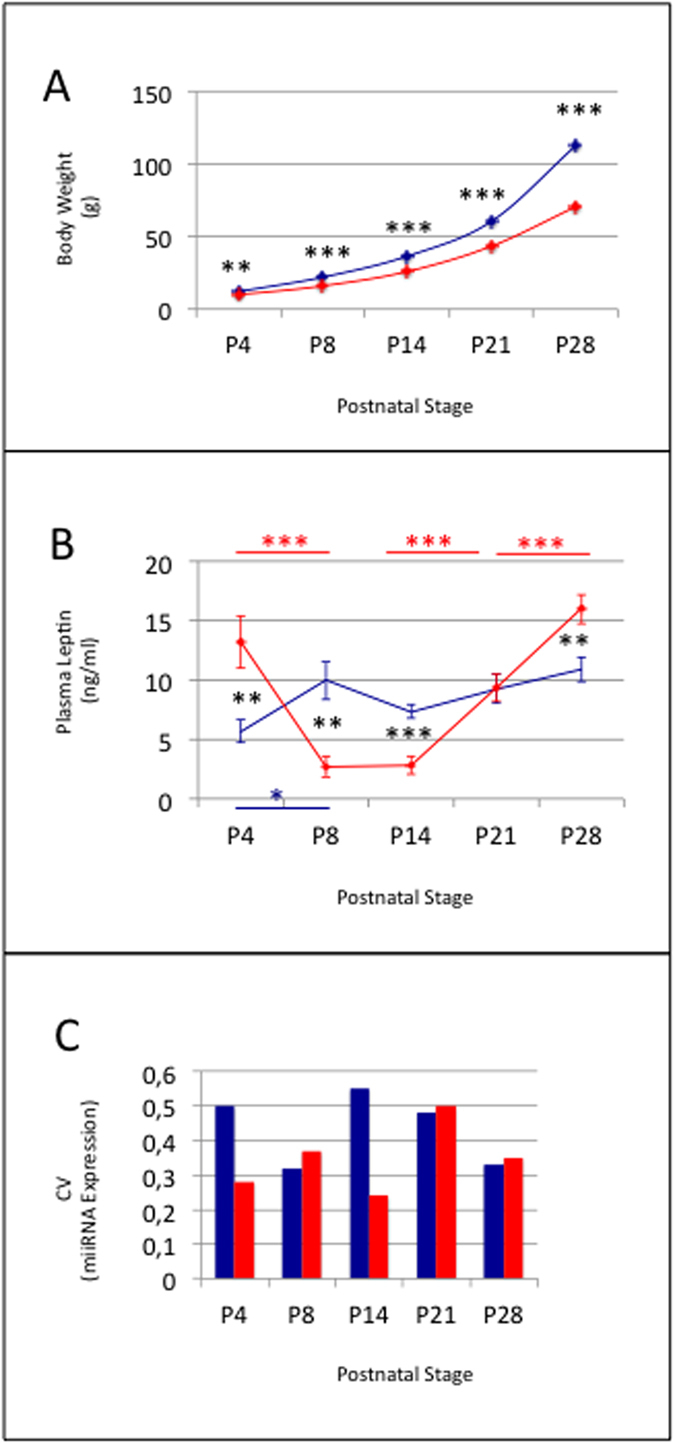
Figure 4. Maternal unbalanced diet impairs progeny body growth and plama leptin levels.

Body weight (A), plasma leptin levels (B) and global CVs of miRNA expression (C) in C- and HF-progeny. Data are shown as mean +− SEM in (A) and (B). C- and HF-progeny are identified by blue and red colors, respectively. Both progeny displayed high homogeneity in body weight at P4, P8, P14, P21 or P28, and hence very low SEMs. Symbols *,** and *** identified p-values <0.05, 0.01 and 0.001, respectively. Symbols in blue and red identify p-values calculated in side-stage comparisons in C- and HF-progeny, respectively. Black symbols identify p-values calculated in progeny comparisons.
