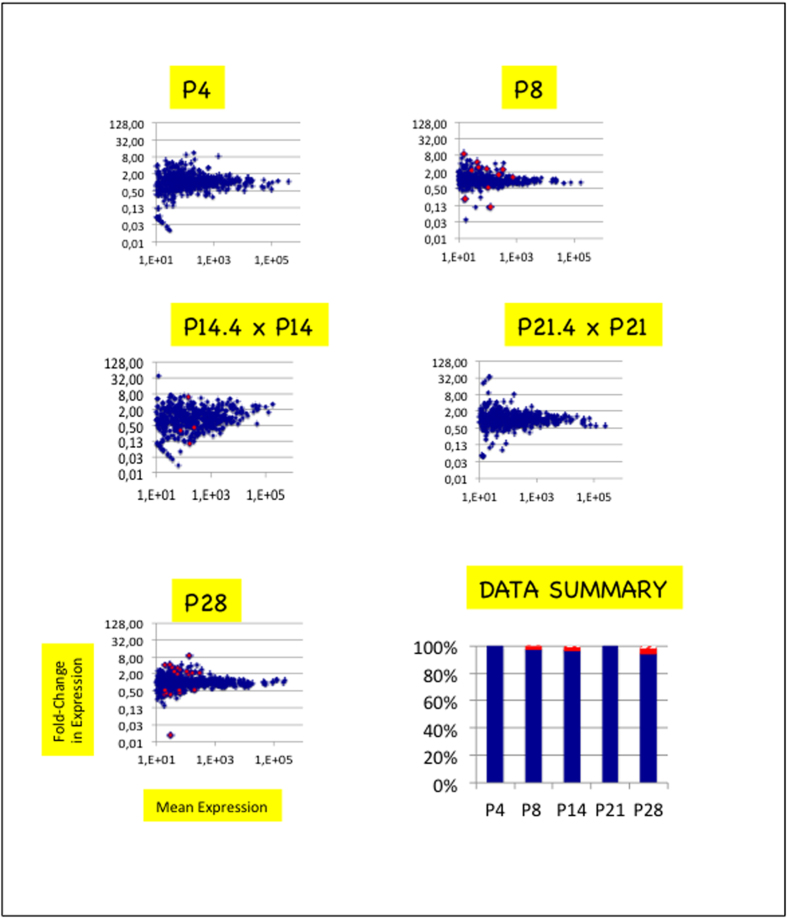
Figure 5. miRNA trancriptomes are almost unmodified in ARC/ME of HF-progeny.
Scatter plots depict comparisons of miRNA expressions of ARC/MEs of progeny born to dams fed a balanced or unbalanced diet at P4, P8, P14, P21 or P28. See the legend of Fig. 2. In histogram in bottom right corner, only the blue and red bars can be seen. Hatched bars that account for <2% of the data are hardly seen.

