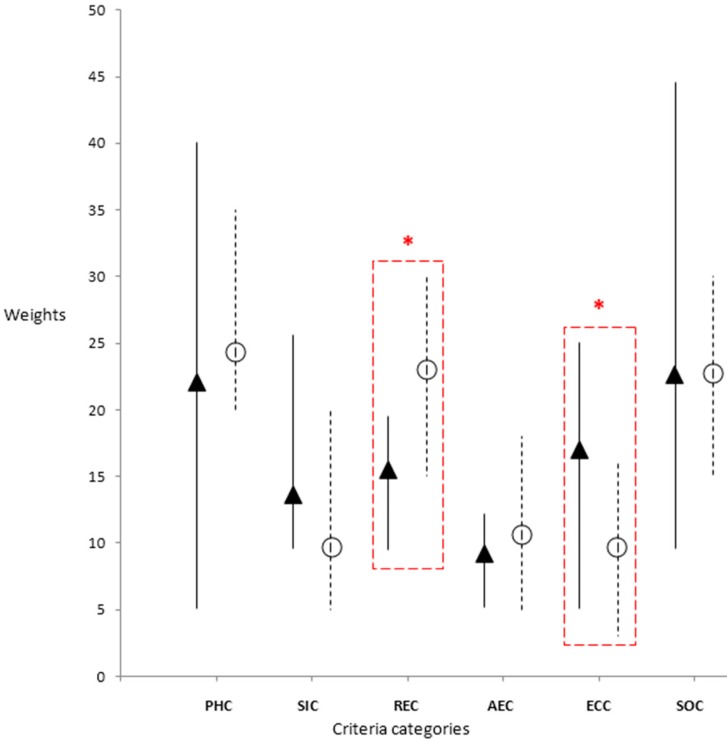
Figure 1.
Average weighting of decision criteria categories by regions (Burkina Faso values are represented by black triangular markers with solid lines and Quebec values are represented by unfilled circular markers and dotted lines. The length of the lines indicates the range of weight values assigned by stakeholders). Criteria categories are shown along the X axis and average weights by category are shown along the y axis. Bars indicate the stakeholder assigned weight ranges for criteria categories. * The differences between the two groups (BF and QC) were found to be significant for the “Risk and Epidemiology” (REC) and “Economic” (ECC) categories only (unequal variance t-test, p < 0.5). Criteria category Legend: PHC: Public Health Criteria; SIC: Social Impact Criteria; REC: Risk and Epidemiology Criteria; AEC: Animal and Environmental Health Criteria; ECC: Economic Criteria; SOC: Strategic and Operational Criteria.

