. 2016 Apr 11;18(16):11042–11057. doi: 10.1039/c6cp00075d

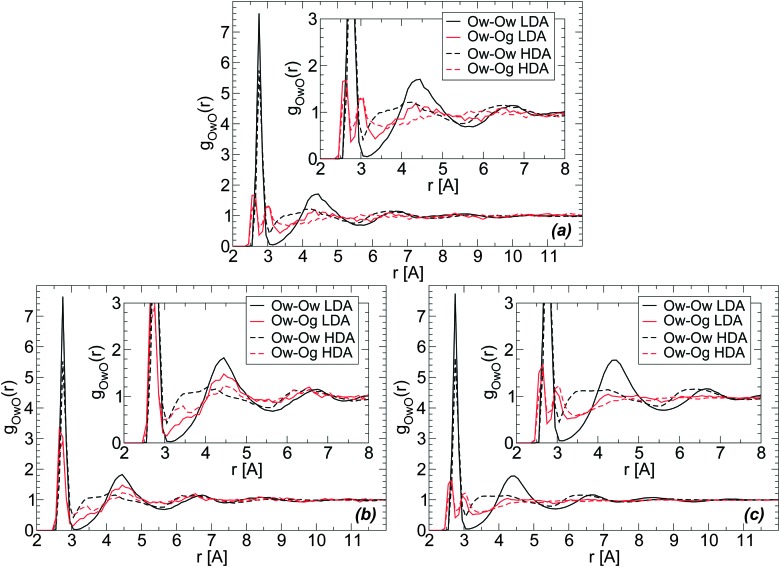
Fig. 7. Radial distribution function of water (Ow) and glycerol (Og) oxygen atoms around water oxygens Ow from MD simulations using the (a) BC+TIP4P/2005 and (b) R+TIP4P/2005 mixture models at T = 80 K and P ≈ 0.1 MPa. χ g = 3.06%, N = 729, and N g = 23. (c) The same as (a) for a larger system, N = 5832 and N g = 184 (χ g = 3.06%). During the LDA-to-HDA transformation, the main change in both Ow–Og and Ow–Ow RDFs (red and black lines, respectively) is the decrease of the peak located at r ≈ 4.5 Å (second hydration shell of water) and decrease in the depth of the minimum located at r ≈ 3.2–3.5 Å (first interstitial shell of water). Insets are magnifications of the corresponding main panel.

Fig. 7