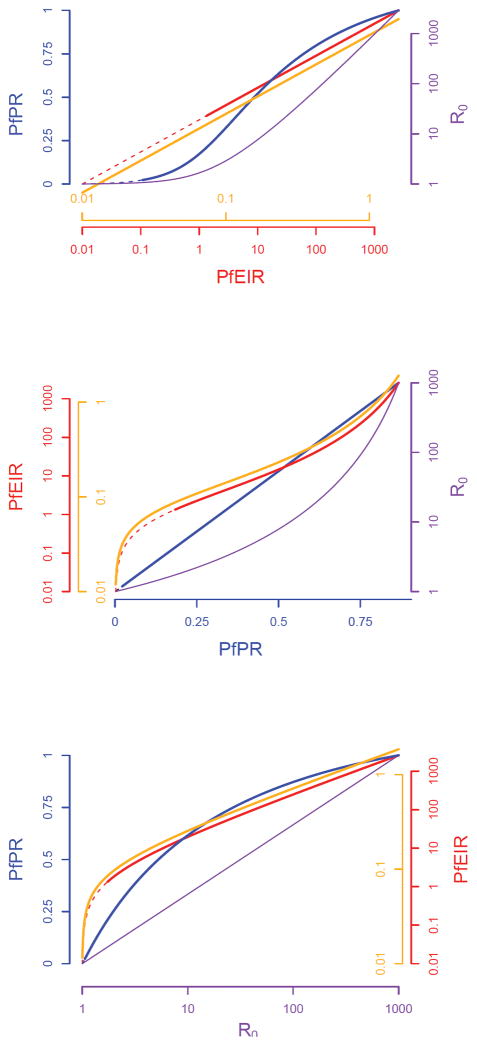
Figure 3. Potential utility of metrics at different levels of endemicity.
Figure 3a: A plot of the logarithm of the annual PfEIR against itself (red), the logarithm of the PfSCR (orange), the PfPR2–10 (blue), and the logarithm of the PfR0 (purple). These relationships are based on one particular model for the steady state relationships. The annual EIR is difficult to measure when the annual EIR is less than one because of the large sample sizes required to catch sufficient vectors both infected and non infected. Similarly, the PR is difficult to measure when it is less than about 1% because of the large sample population sizes that need to be screened. For both measures the solid line indicates those values where it can be measured accurately with reasonable effort, while the dashed line illustrates where the accuracy will wane. The cut-offs for “reasonable effort” could vary depend on costs and priorities. The SCR has some advantages because it can be measured across the spectrum. Nothing is implied about the effort required to measure R0, since it is generally inferred from the other metrics, based on some transmission model. The shapes of the curves have all been standardized to have the same minimum and maximum over the observed range of values to illustrate how the shapes of these curves affect the relative amount of information about transmission at different points along the spectrum. The steeper the curve, the more information that is conveyed about one metric relative to another. Figure 3b and 3c are the same curves with the PfPR2–10 and the logarithm of the R0 on the x-axis respectively. We have not attempted to incorporate any estimates of error in to these plots.

