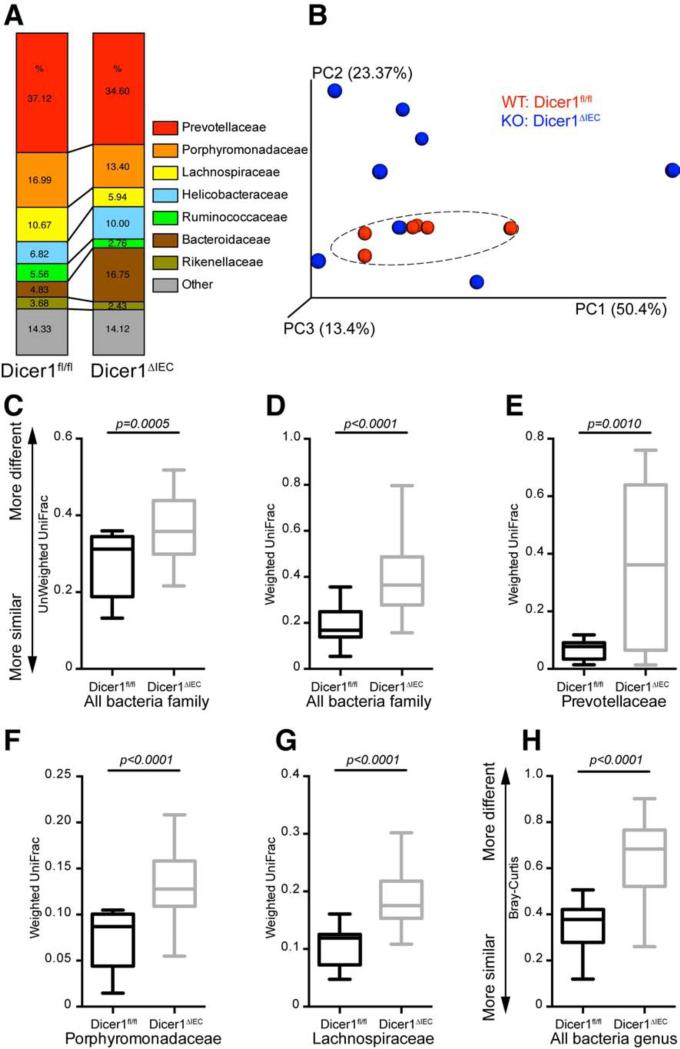
Figure 3. Deficiency of Intestinal Epithelial Cell miRNA Increases the Dissimilarity of the Gut Microbiota.
Bacterial 16S rDNA sequence-based surveys were performed on the feces of 16 mice (n=7 Dicer1fl/fl, 9 Dicer1ΔIEC mice). (A) Relative abundance of bacteria was classified at a family-level taxonomy. (B) Principal coordinates analysis (PCoA) based on weighted UniFrac metrics. Dashed circle indicates the clustering of Dicer1fl/fl samples. (C-H) Box and whiskers plots of β-diversity distances between microbial communities comparing individuals within Dicer1fl/fl mice and between Dicer1ΔIEC individual mice. (C-G) β-diversity at family level: (C and D) of the whole microbiota; (E) the bacterial family Prevotellaceae; (F) the bacterial family Porphyromonadaceae; (G) the bacterial family Lachnospiraceae. (H) β-diversity at the genus level. (C-H) the specific distance metric used in each analysis is indicated on the axes. Values are: box: median, whiskers: min to max, p-value: non-parametric t-test).

