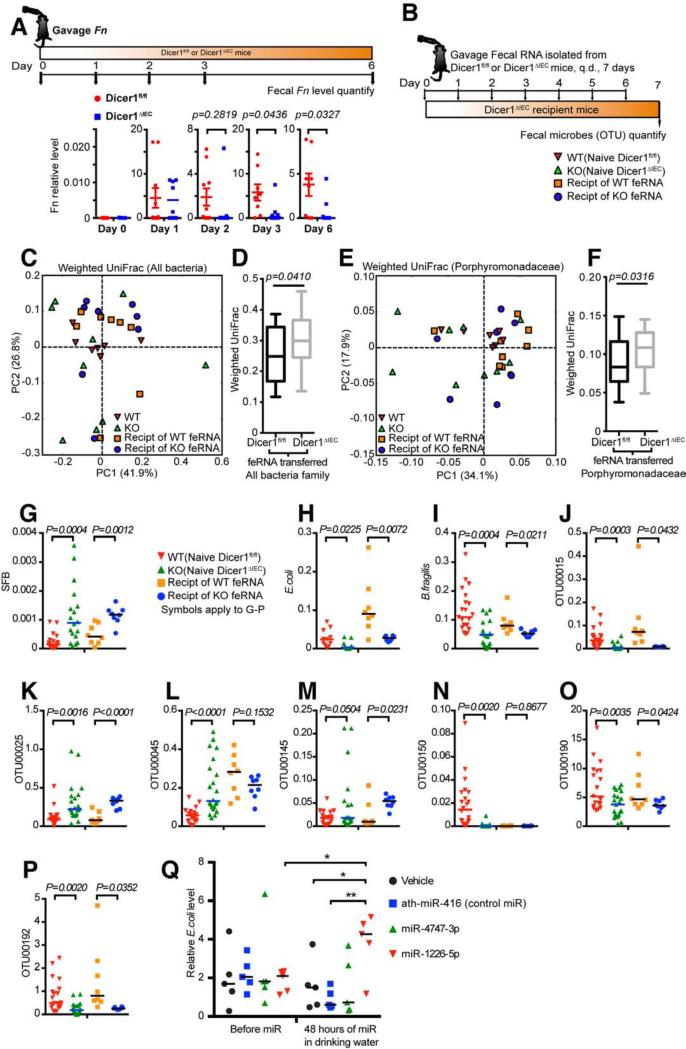
Figure 6. WT Fecal RNA Transplantation Restores the Fecal Microbes in IEC miRNA-deficient Mice.
(A) WT (Dicer1fl/fl) or Dicer1ΔIEC Mice were gavaged Fn. The relative abundance of Fn in the mouse feces was monitored by qPCR at gavage (day 0), day 1, day 2, day 3 and day 6-post gavage. Data are mean ± SEM, t-test, n≥8 mice and 6 littermate pairs per group, summary of two independent experiments. (B) Schematic diagram of fecal RNA transplantation that applies to (C-P): Donor fecal RNA (feRNA) was isolated from Dicer1fl/fl or Dicer1ΔIEC mice and was transferred by gavage once daily (q.d.) for 7 days to Dicer1ΔIEC recipient mice (Recipt), one donor to one recipient. (C-F) Bacterial 16S rDNA sequence-based UniFrac similarity matrix of the 18 recipient mice (n=8 Dicer1fl/fl fecal RNA recipients, 8 Dicer1ΔIEC fecal RNA recipients) was performed on the feces and compared with naïve mice as presented in Figure 3 of the Dicer1fl/fl and Dicer1ΔIEC mice. (C and E) Principal coordinates analysis (PCoA) of weighted UniFrac values of 4 groups. Each point represents one mouse sample and each sample is colored according to gene background or treatment. (C) Weighted UniFrac PCoA clustering results for all bacteria. (E) Weighted UniFrac PCoA clustering results for the family of Porphyromonadaceae. (D and F) Box and whiskers plots of β-diversity unifrac values between individuals within Dicer1fl/fl fecal RNA recipients and between Dicer1ΔIEC fecal RNA recipients of all bacteria (D) and the bacterial family Porphyromonadaceae (F). (Values are: box: median, whiskers: min to max, p-value: non-parametric t-test).
(G-P) Symbiotic bacteria SFB (G), E. coli (H), B. fragilis (I) loads in the naïve Dicer1fl/fl and Dicer1ΔIEC mouse feces, as well as in the feces of Dicer1ΔIEC mice received fecal RNA, were determined and the loads of the bacterial OTU00015 (J), OTU00025 (K), OTU00045 (L), OTU00145 (M), OTU00150 (N), OTU00190 (O) and OTU00192 (P) as tagged in Figure S2E were determined by qPCR (naïve group, n≥11, fecal RNA transplanted group, n=8). (Values are mean ± SEM, t-test).
(Q) C57BL/6J mice were administrated 200 nM indicated synthesized miRNA mimics in drinking water for 48 hours and the relative abundance of E. coli in the feces was determined by qPCR (n=5, scatter dot plot with line at median, One-way ANOVA followed by Dunnett's multiple comparison tests. *p<0.05, **p<0.01).

