
Figure 3. Prediction of the TM α-helices of the glutamate transporter, GltPh and FeoB.
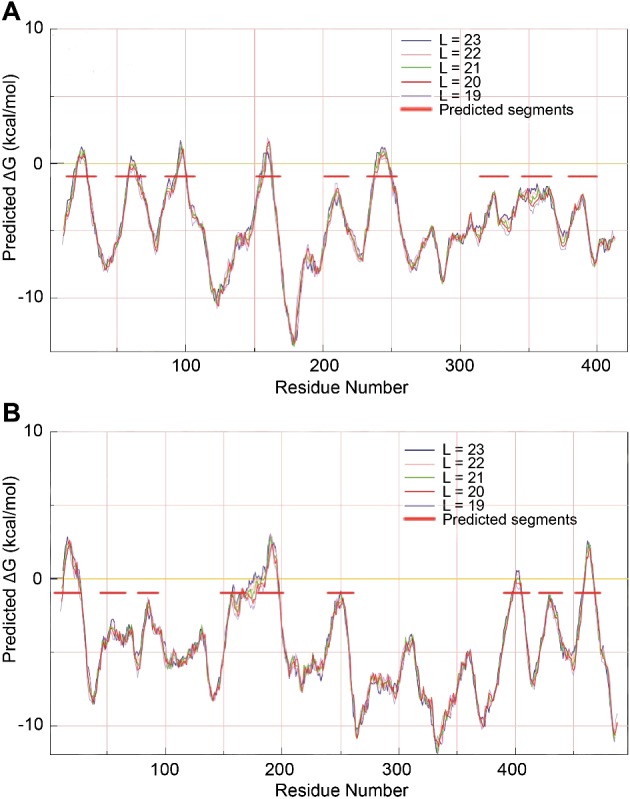
Hydropathy plot of GltPh (A) and FeoB (B), according to translocon analysis by the Mpex programme. The positions of membrane-spanning α-helices are identified as peaks with horizontal red bars. L indicates the lengths of the sequence of residues in the model.