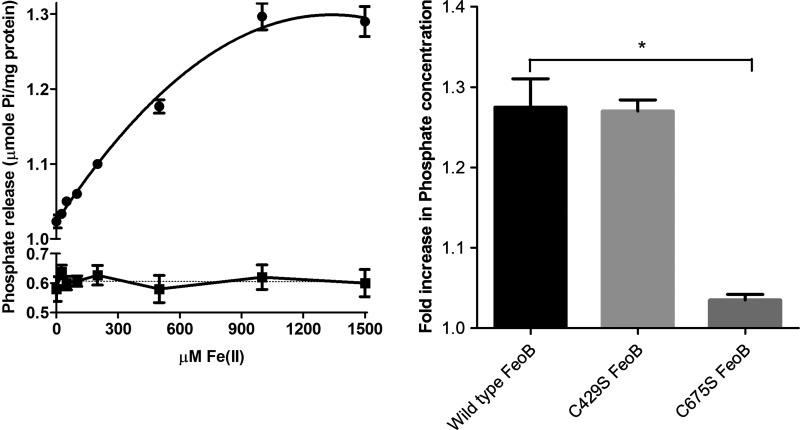
Figure 8. Effect of Fe2+ on the GTPase activity of FeoB.
(A) GTPase activity of wild-type FeoB (●) and D123N FeoB (■) was measured in the presence of varying concentrations of FeSO4 (0–1.5 mM). FeSO4 stimulated activity was observed with maximum stimulation at a FeSO4 concentration of 1 mM (n=6). (B) GTPase activity of wild-type FeoB and FeoB mutants (all 30 μg) was measured in the presence and absence of FeSO4 (1 mM). The fold increase in Pi concentration after 4 h between stimulated and unstimulated proteins was calculated; *P<0.005, compared with wild-type, n=4, one-way ANOVA.

