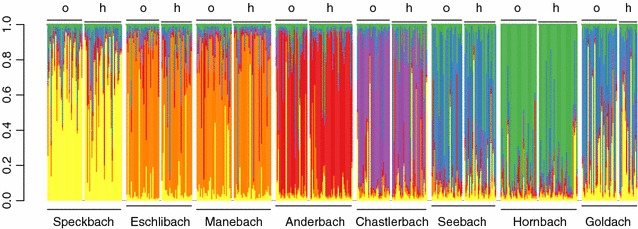
Fig. 4.

Estimated genetic population structure of Gammarus fossarum in eight tributary streams of Lake Constance, based on microsatellite data. The graph is based on the STRUCTURE run of the highest estimated probability run with K = 6. Each individual is represented with a single vertical line partitioned into different colours. Each colour represents a different cluster. Streams are ordered in the figure from west to east. Within stream, individuals either originated from the stream outlet (o) or the headwater reaches (h)
