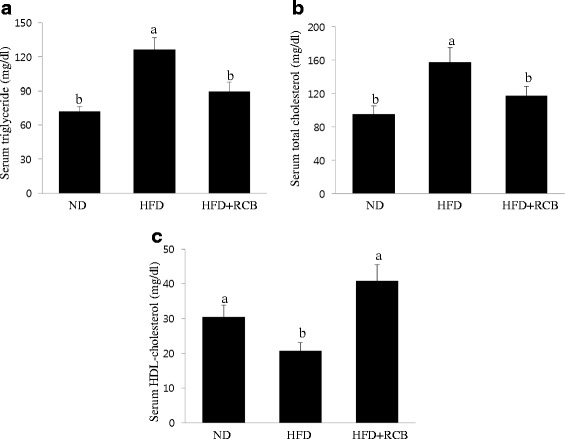
Fig. 5.

Effect of RCB on lipid content in HFD-induced obese rats. a Serum triglyceride level. The RCB extract-administered group showed significantly lower levels of serum triglyceride compared with the HFD group. Data are expressed as the means ± SD. Differences among multiple groups were analyzed with ANOVA followed by Duncan’s multiple range test. Different letters (a and b) indicate that the column means are significantly different at P < 0.05. b Total cholesterol level. Total cholesterol level decreased in the RCB-treated groups compared to the HFD only group. The results are presented as the means ± SD. Different letters (a and b) indicate that the column means are significantly different; p < 0.05 according to Duncan’s multiple range test. c HDL cholesterol level. A significant difference was observed in HDL cholesterol levels between the HFD and HFD + RCB groups. The values are expressed as the means ± SD. Different letters (a and b) on the each bar graph mean that values are significantly different among groups; p < 0.05 according to Duncan’s multiple range test
