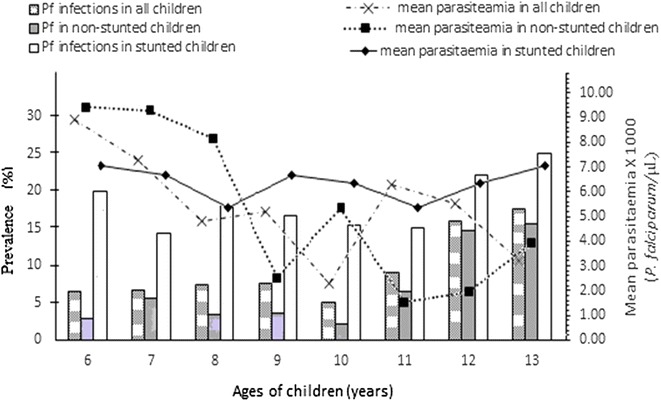
Fig. 2.

Age-specific distribution of P. falciparum infections in children with stunted and non-stunted malnutrition compared to mean parasitaemia. Pf, Plasmodium falciparum. For P. falciparum infections among all children, the trend of infections declines with increasing age (X2 for trend, P = 0.036); among non-stunted children, the trend of infections declines with increasing age (X2 for trend, P = 0.04); among stunted children, a zero linear trend observed with increasing age (X2 for trend, P = 0.196). For mean parasitaemia among all children, non-significant negative correlation with age (r = −0.650, r2 = 0.423, P = 0.081); among non-stunted children, significant drift towards lower parasitaemia of P. falciparum with increasing age (r = −0.816, r2 = 0.666, P = 0.014); among stunted children, P. falciparum parasitaemia relatively remained similar with increasing age (r = −0.087, P = 0.837)
