Fig. 6.

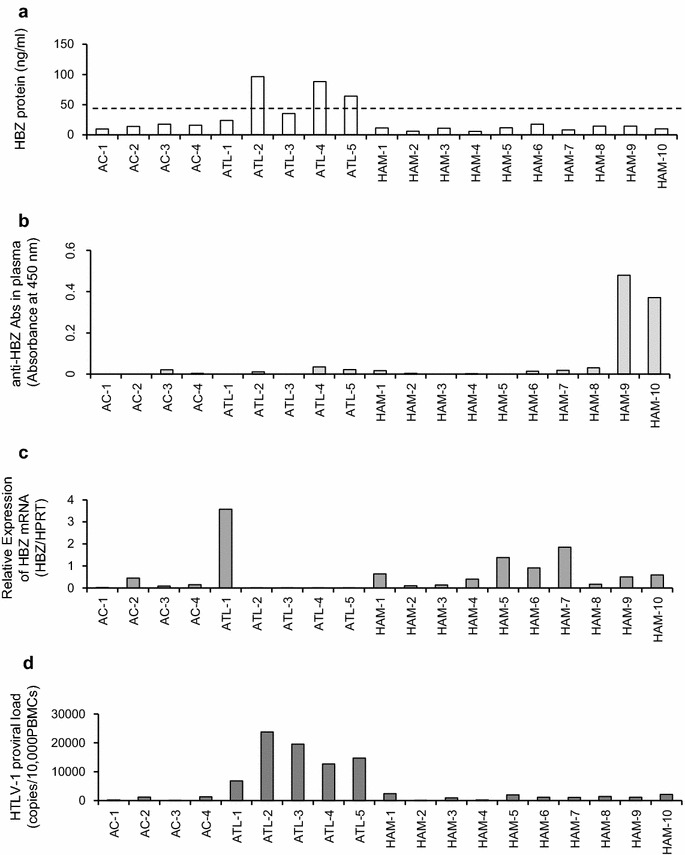
Quantification of HBZ protein expression levels and comparison to HBZ mRNA load, anti-HBZ antibody levels, and PVL in clinical samples from HTLV-1-infected individuals with different clinical status. a HBZ protein expression levels in naturally infected PBMCs of HTLV-1-infected individuals with different clinical status, evaluated by an in-house sandwich ELISA using mAbs against HBZ. HBZ protein was detected in three out of five acute ATL patients examined, but not in HAM/TSP patients (zero out of ten) or ACs (zero out of four). The dotted line represents the cutoff, i.e. the mean OD plus twice the standard deviation of four HTLV-1 uninfected cells (CEM, Jurkat, and two normal uninfected PBMCs). b Anti-HBZ antibody levels in plasma of HTLV-1-infected individuals with different clinical status determined by ELISA using a recombinant HBZ protein. c HBZ mRNA levels in PBMCs of HTLV-1-infected individuals with different clinical status determined by real-time PCR. HBZ mRNA expression were normalized to the expression of the hypoxanthine phosphoribosyltransferase gene (Human HPRT1 Endogenous Control 4333768; Applied Biosystems). d HTLV-1 proviral load (PVL) in PBMCs of HTLV-1-infected individuals with different clinical status. The HTLV-1 PVL was determined using the following formula: HTLV-1 tax copy number per 1 × 10⁴ PBMCs = [(tax copy number)/(β-actin copy number/2)] × 104. All samples were analyzed in triplicate
