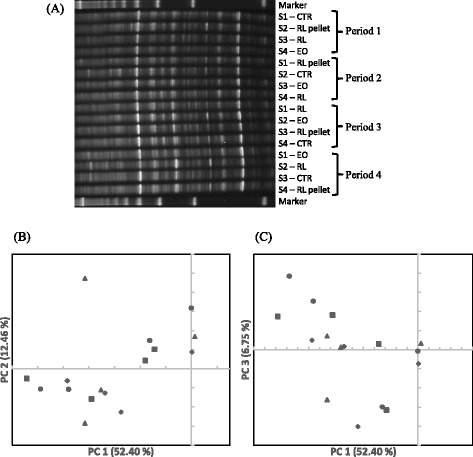
Fig. 1.

DGGE profiles (a) and PCA plots (b and c) of bacteria. S1, S2, S3, and S4: sheep 1, 2, 3, and 4, respectively. CTR (●): control; RL pellet (■): CTR plus 10 g/d of dried and ground rosemary leaves pelleted into the concentrate; RL (♦): CTR plus 10 g/d of dried and ground rosemary leaves; EO (▲): CTR plus 7 g/d of rosemary essential oil adsorbed on an inert support
