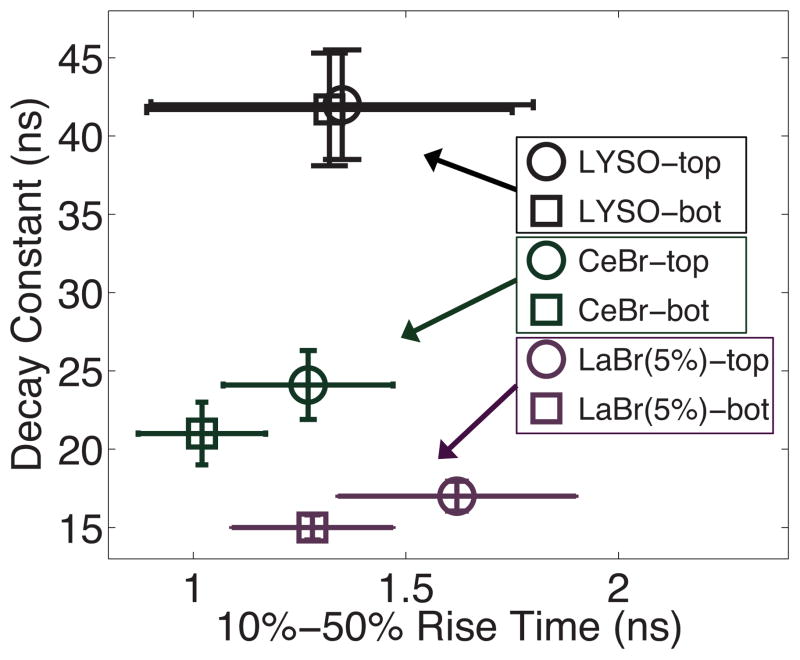
Figure 8.
Signal characteristics of crystal pairs consisting of the same scintillation material; for LYSO a stack of two identical 4×4×11 mm3 crystals were used, for CeBr3 two 4×4×12 mm3, and LaBr3(Ce:5%) two 4×4×15 mm3. Optical grease was used for the crystal-to-crystal coupling (n=1.46). Using a large set of acquired waveforms the mean signal rise time and signal decay constant is plotted, from two side-on acquisitions in the center of each crystal layer; error bars represent two standard deviations in both signal rise time and signal decay constant.

