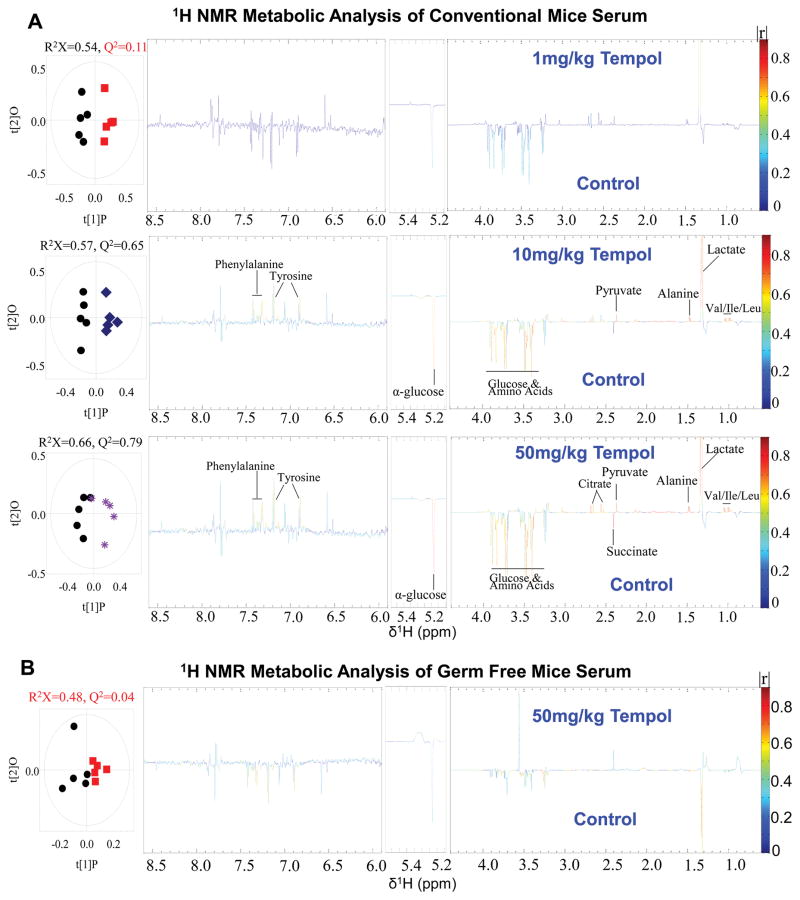
Figure 3.
Serum metabolites are associated with increased glycolysis in conventionally raised mice treated with increasing doses of tempol. (A) Comparison of serum metabolic profiles of conventionally-raised mice between control group (black circles) and 1 mg/kg (red squares), 10 mg/kg (blue squares), and 50 mg/kg (purple asterisks) tempol groups determined by 1H NMR. O-PLS-DA scores (left) and the coefficient-coded loadings plots (right) for the models obtained from the NMR spectra of serum extracts (n=5 mice per group). (B) Comparison of serum metabolites between control group (black circles) and 50 mg/kg tempol group (red squares) determined by 1H NMR in germ-free mice (n=5 mice per group).

