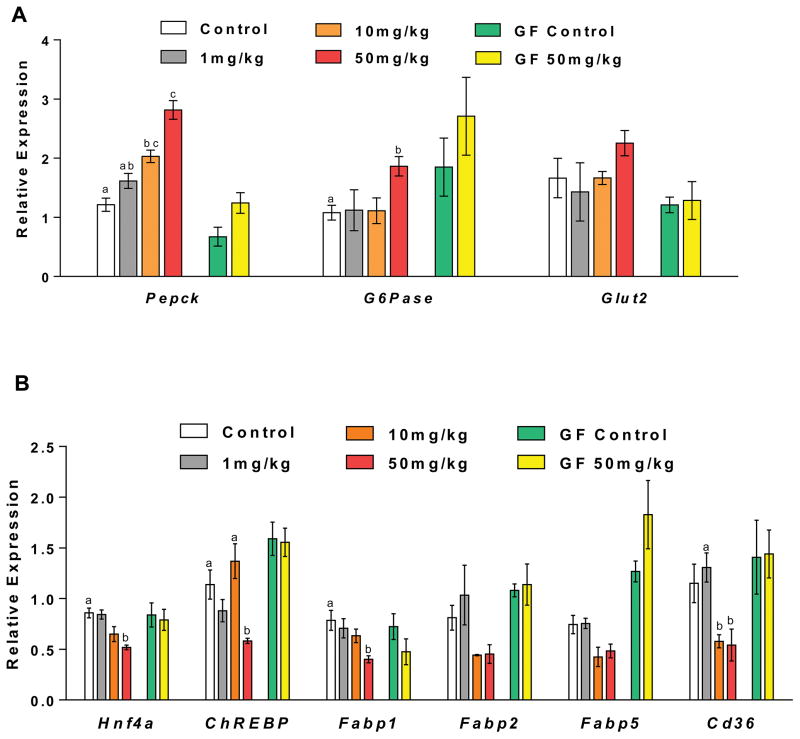
Figure 4.
Tempol altered hepatic expression of genes involved in glucose and lipid metabolism. QPCR analysis of hepatic mRNA levels of (A) glucose metabolism related genes, (B) lipid metabolism related genes in conventionally-raised and germ-free mice after 5-day tempol treatment. Groups with different letters are significantly different (p<0.05). Groups without labels are not significantly different from other groups. All data are presented as mean ± SEM (n=5 mice per group) and analyzed using one-way ANOVA with Tukey’s correction, or two-tailed Student’s t-test.

