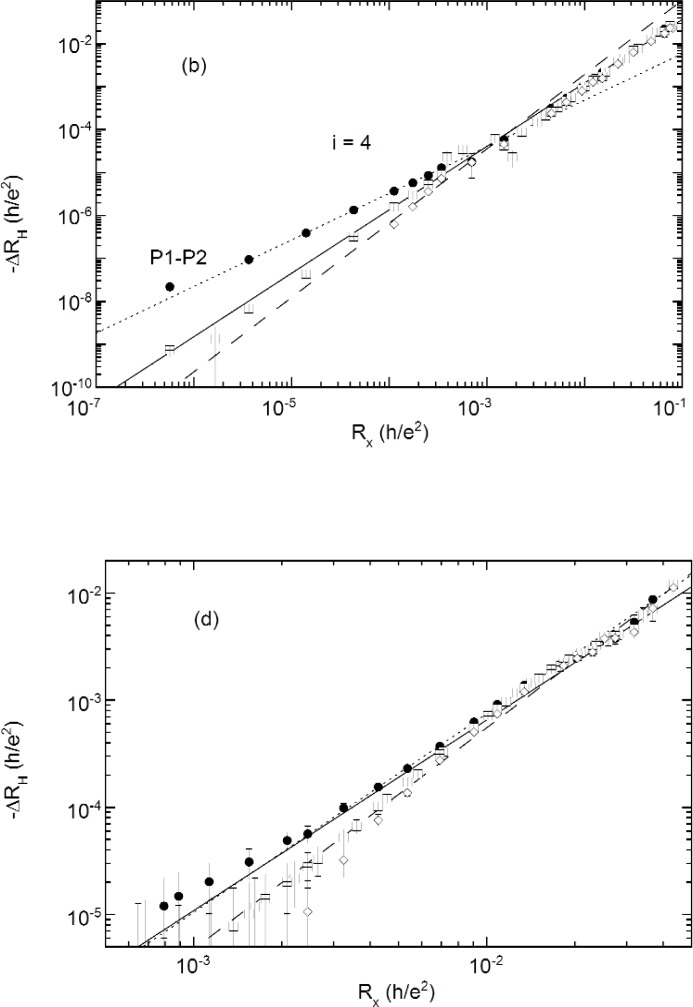
Fig. 7c, d.
Parametric plot of −∆RH vs Rx as the temperature is varied for (c) i = 6, (d) i = 8. Three different probe sets (Fig. 1) were used to measure RH: P1–P2 (solid circles), P3–P4 (open squares), and P5–P6 (open diamonds). Note that the power law dependence holds over many orders of magnitude in ∆RH and Rx, e.g., seven orders of magnitude for i = 2.

