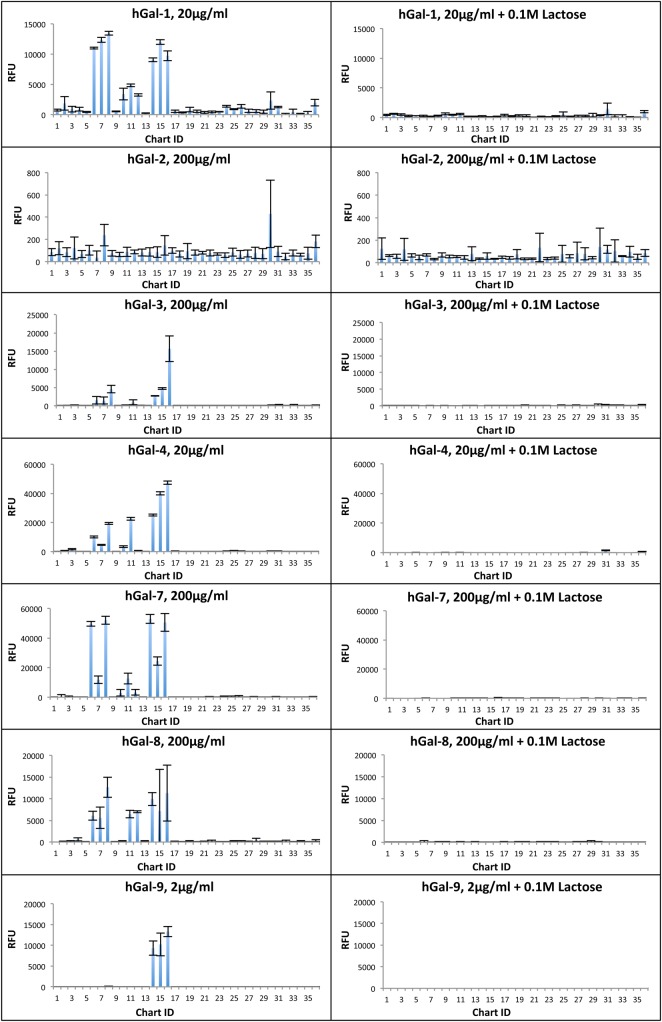
Fig. 3.
Summary of defined HMG microarray binding by galectins. One concentration of each biotinylated galectin screened on the HM-SGM-v2 shotgun microarray (left panels) along with the same concentration of galectin screened in the presence of 0.1 M lactose (right panels). Streptavidin-Cy5 was used for detection. Error bars represent the standard deviation of binding to four technical replicates printed on the array after removing the highest and lowest RFU value of six total technical replicates. Refer to Supplementary data, File 3 for the total data from these screenings at all concentrations of all galectins in the presence and absence of 0.1 M lactose. This figure is available in black and white in print and in color at Glycobiology online.

