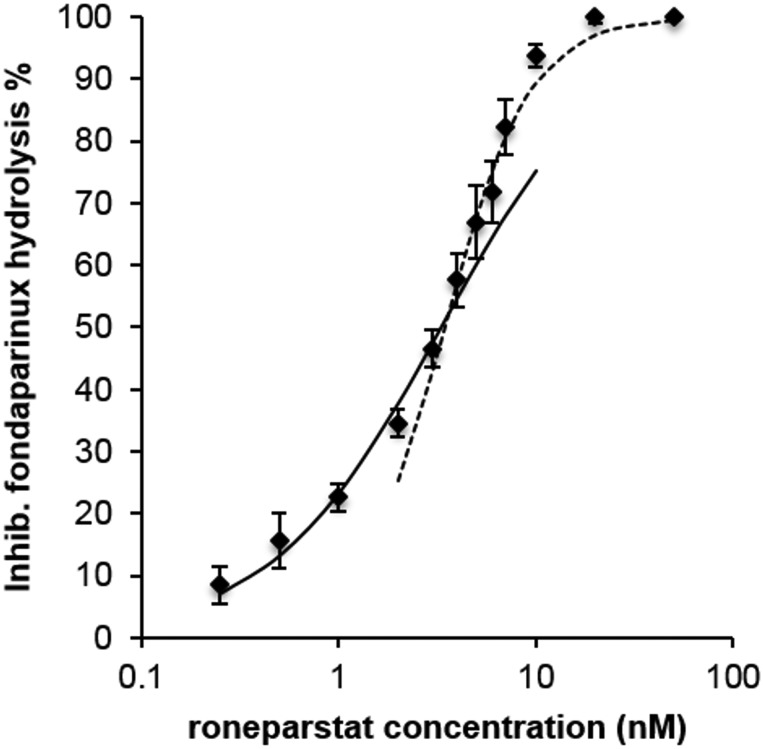
Fig. 3.
Inhibition of fondaparinux (75 µM) hydrolysis, expressed as % of maximum inhibition, vs inhibitor concentration (log scale). Continuous line: Hill function with nH = 1, fitted to data with roneparstat concentrations ≤4 nM. Hashed line: Hill function with nH = 2, fitted to data with roneparstat concentrations ≥4 nM. Vertical bars represent standard deviation of single measurements (n = 4).

