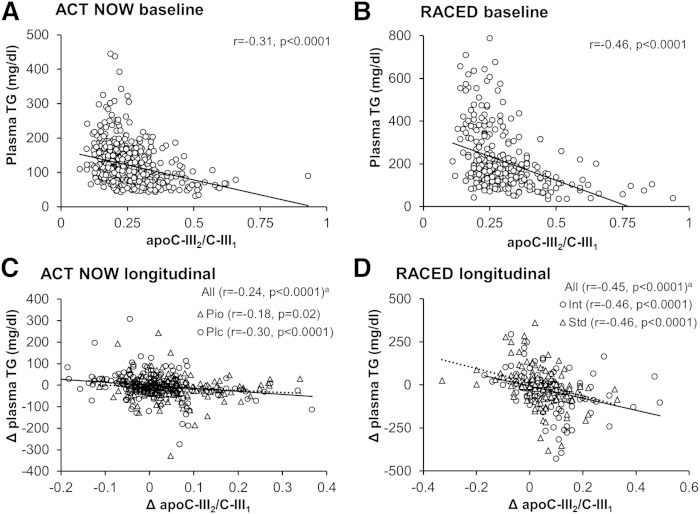
Fig. 2.
Associations between the apoC-III2/apoC-III1 ratio and plasma triglycerides. Scatter plots (with regression lines) and Spearman correlation coefficients of baseline values of (A, B) and longitudinal changes in (C, D) plasma triglycerides with apoC-III2/apoC-III1 in the ACT NOW and RACED cohorts. a, partially adjusted for treatment. Pio, pioglitazone; Plc, placebo; Int, intensive glucose-lowering therapy; Std, standard glucose-lowering therapy.

