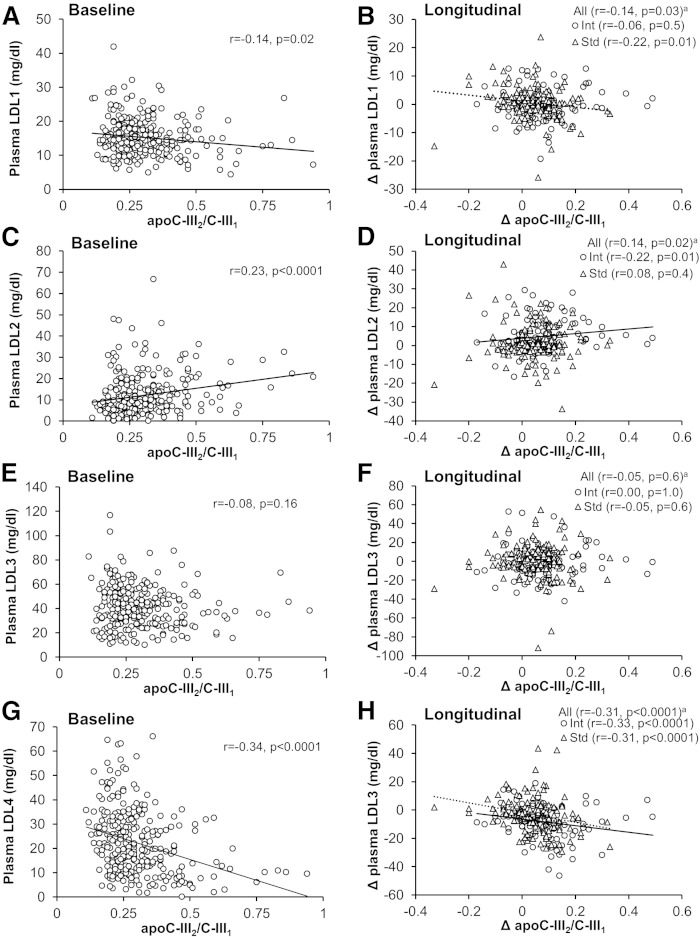
Fig. 3.
Spearman correlations between baseline values (n = 258) and longitudinal changes (Δ, follow-up minus baseline, n = 253) of apoC-III2/apoC-III1 ratio and fasting LDL-cholesterol subclass concentrations [LDL1 (A, B); LDL2 (C, D); LDL3 (E, F); LDL4 (G, H)] in the RACED cohort. Data are Spearman correlation coefficients. apartially adjusted for treatment. Int, intensive glucose-lowering therapy; Std, standard glucose-lowering therapy.

