
Figure 1.
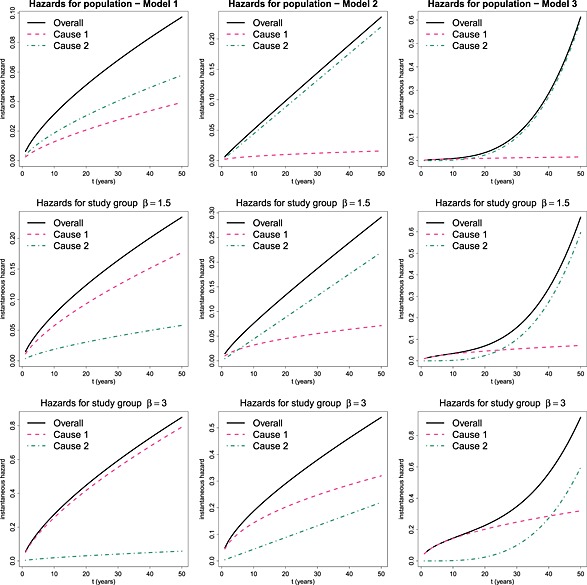
Hazard functions for data simulated for the population (first row) and study group with β = 1.5 (second row) and β = 3 (third row); under models 1 (left), 2 (middle) or 3 (right).
Official websites use .gov
A
.gov website belongs to an official
government organization in the United States.
Secure .gov websites use HTTPS
A lock (
) or https:// means you've safely
connected to the .gov website. Share sensitive
information only on official, secure websites.
Hazard functions for data simulated for the population (first row) and study group with β = 1.5 (second row) and β = 3 (third row); under models 1 (left), 2 (middle) or 3 (right).