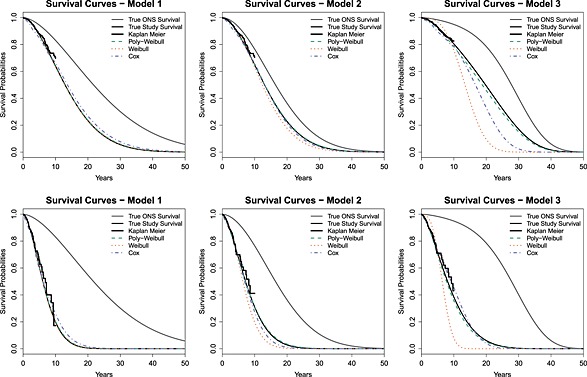
Figure 4.

True and fitted survival curves for one simulation replicate, under true models 1, 2, and 3, and β = 1.5 (top) or β = 3 (bottom)

True and fitted survival curves for one simulation replicate, under true models 1, 2, and 3, and β = 1.5 (top) or β = 3 (bottom)