
Fig. 4.
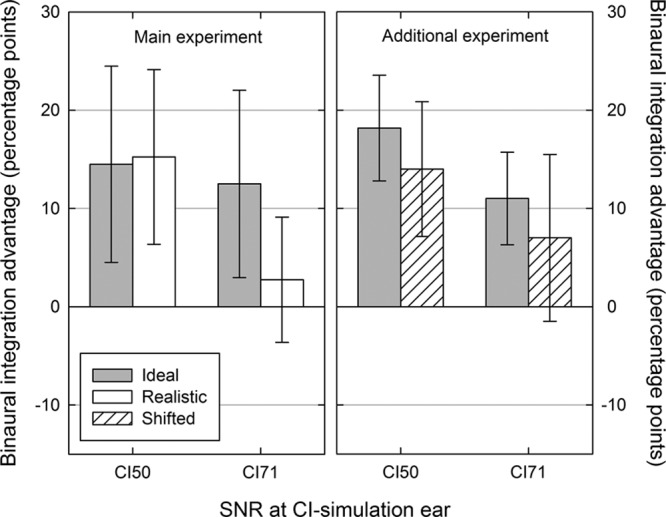
Mean binaural integration advantages for the Ideal (gray bars), Realistic (white bars), and Shifted (striped bars) processing strategies in the main experiment (left panel) and in the additional experiment (right panel). Binaural integration advantages were calculated as the change in the percentage of sentences recalled correctly when listening binaurally relative to listening monaurally using the CI-simulation ear alone (right panel). Error bars indicate 95% confidence intervals. CI indicates cochlear implant; SNR, signal to noise ratio.