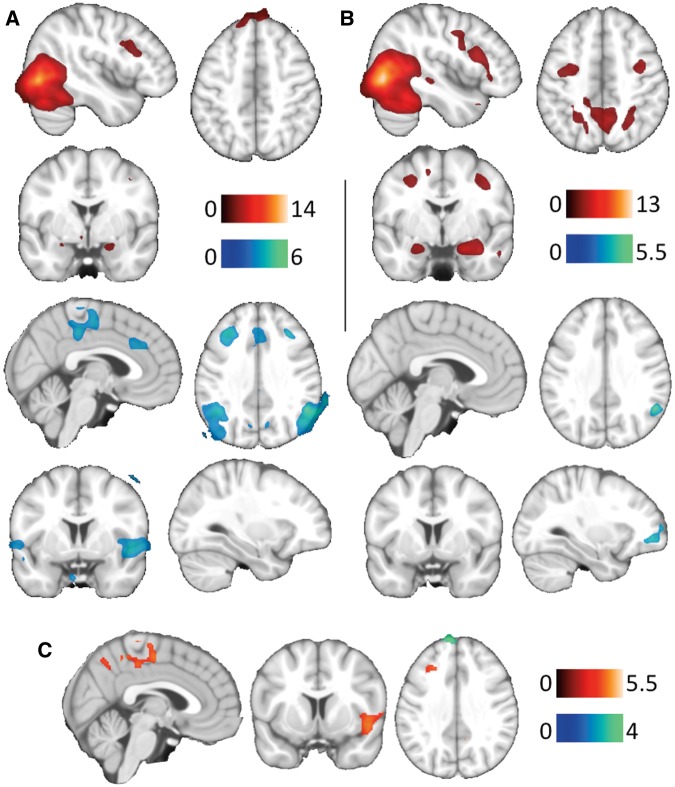
Fig. 2.
Main group activations (red) and deactivations (blue) to GV>N in criminals (A) and batterers (B). Between-group differences (C) show increased (red) and decreased (blue) brain activity in batterers. The right hemisphere corresponds to the right side of the axial and coronal views, and sagittal images show the right hemisphere in all views. The color bar indicates t-values.

