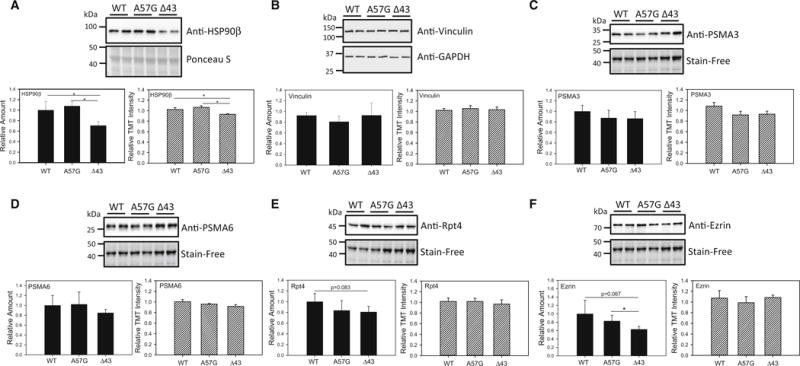
Fig. 3.

Validation of proteomic analyses by Western blotting in WT, Δ43 and A57G hearts. a Expression of HSP-90β. b Expression of Vinculin; c expression of 20S proteasome subunit, PSMA3. d Expression of 20S proteasome subunit, PSMA6. e Expression of 19S proteasome subunit, Rpt4. f Expression of Ezrin. Bar charts containing black bars indicate the protein expression determined by Western blotting, while striped white bars represent the protein expression as determined by TMT labeling of heart lysates and quantification by mass spectrometry. Note no changes in expression of any proteasome subunits between A57G and Δ43 hearts, while differences between pathological (A57G) and physiological (Δ43) hypertrophy were noted in expression of HSP-90β and Ezrin
