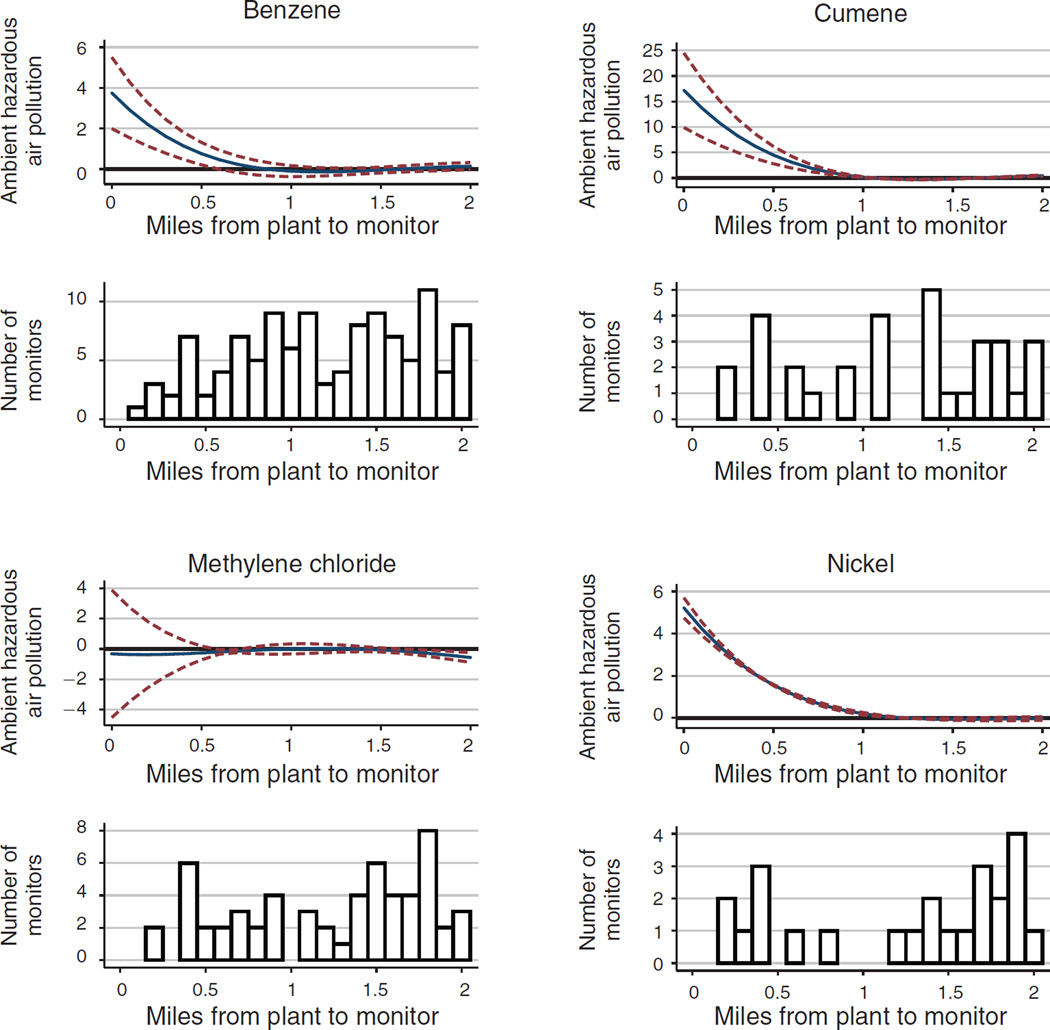
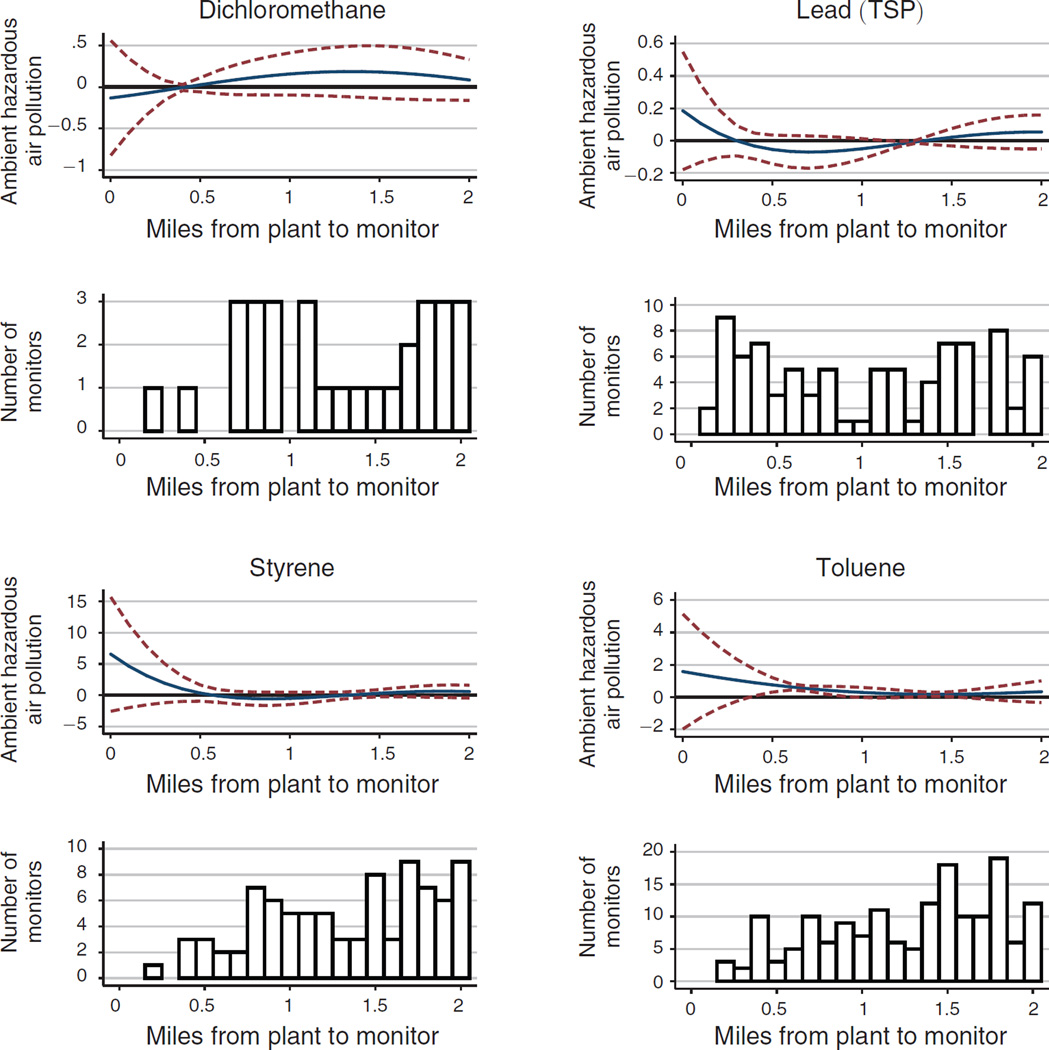
Figure 1. The Effect of Toxic Plants on Ambient Hazardous Air Pollution.
Notes: This figure plots marginal effects and ninety-fifth percentile confidence intervals from 8 separate regressions of a single form of ambient hazardous pollution on a quartic in distance to the nearest operating toxic plant. The unit of observation is the monitor-plant pair and all regressions include monitor-plant fixed effects so the distance gradient is identified using plant openings and closings. In the regression sample, each pollutant has been standardized to be mean 0 and standard deviation 1. The distance gradient can therefore be interpreted as standard deviations from the mean value. Standard errors for the regression are two-way clustered on plant and monitor, and the pointwise standard errors in the figure are calculated using the delta method. Below each pollutant specific graph is a histogram, representing the number of monitors at various distance bins from the plants in the sample.


