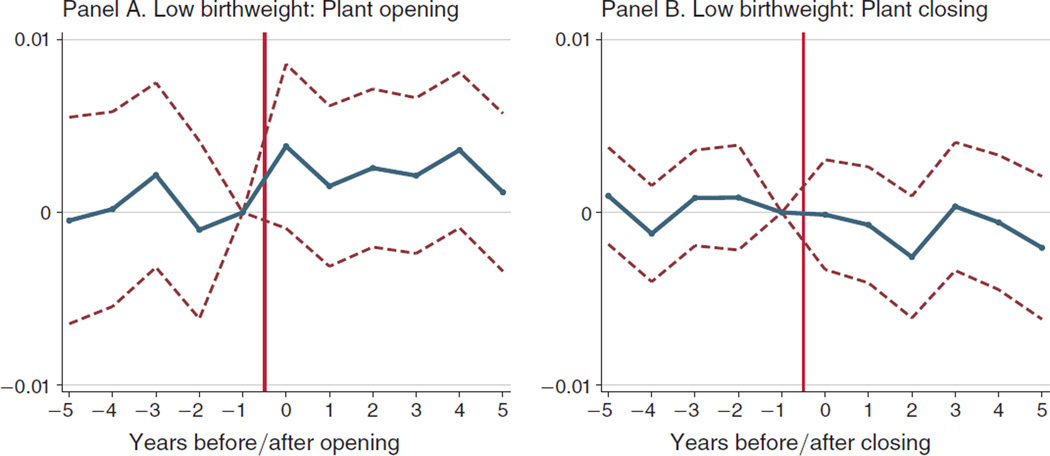
Figure 4. Event Study: The Effect of Toxic Plant Openings and Closings on the Incidence of Low Birthweight.
Notes: These are event study plots created by regressing the incidence of low birthweight for a plant-by-distance by year cell on a full set of event time indicators interacted with an indicator for “near,” plant-by-distance fixed effects, plant-by-year fixed effects, and census controls (interacted with quadratic trends), weighting by the group-level cell size. The dependent variable in the regression is the residualized mean incidence of low birthweight for a plant-by-distance-by-year, adjusted for micro-level covariates in a first stage. Reported are the coefficients for event-time, which plot the time path of low birthweight “near” relative to “far” before and after a plant opening or closing. “Near” is defined as less than 1 mile between a plant and a house, and “far” is defined as 1–2 miles between a house and plant. The dashed lines represent 95 percent confidence intervals, where standard errors are computed using two-way cluster-robust standard errors, clustering on plant and year. Time is normalized relative to the year that the plant’s operating status changes (τ = 0), and the coefficients are normalized to zero in the year prior to a change in operating status (τ = −1).

