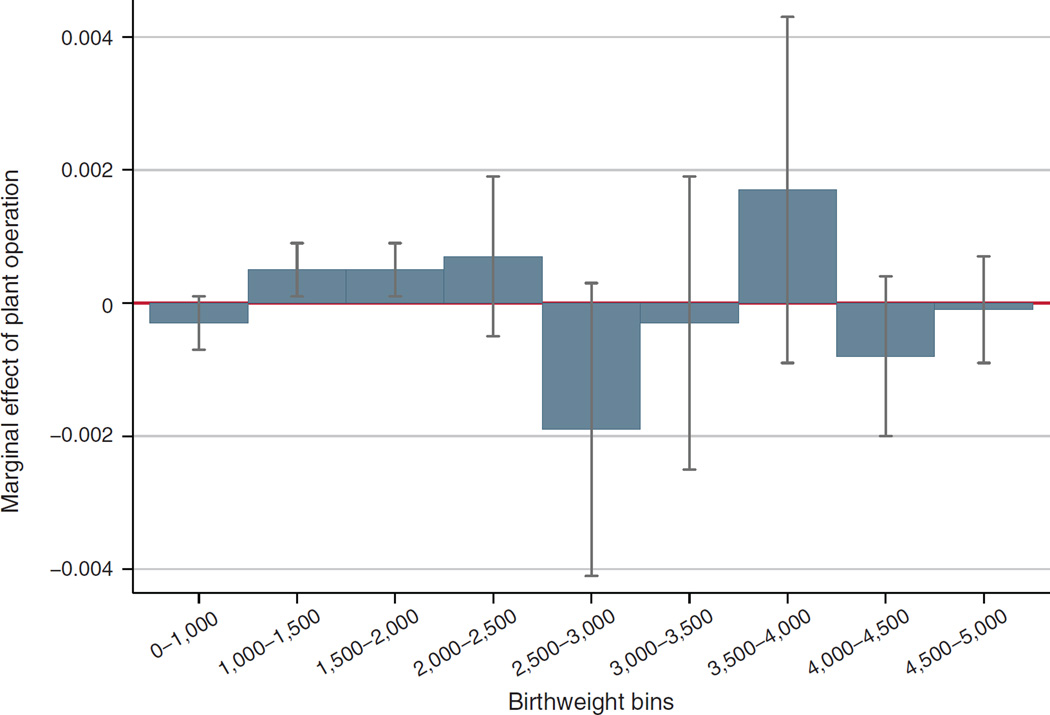
Figure 5. Effect of Plant Operation on the Distribution of Birthweight 0–1 Miles from a Plant.
Notes: This figure reports regression coefficients from nine separate regressions. The dependent variable in each regression is an indicator variable for whether a birth falls in a particular birthweight range as indicated on the x-axis, and the data have been aggregated to plant-by-distance by year cells. The estimates reflect the effect of plant operation on “near” relative to “far” birth outcomes. All regression estimates control for census tract characteristics (interacted with quadratic trends) and regressions are weighted by the group-level cell size. Multiple births are dropped from regressions. Standard errors are two-way clustered by plant and year, and reported confidence intervals reflect 2 standard errors above and below the estimate.

