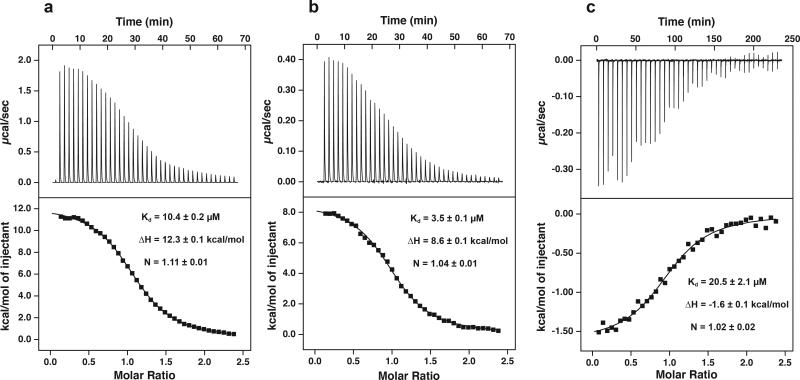
Figure 2.
ITC titrations for Spy binding to wild-type Im7 and variants. (a) Titration of 150 μM Im7-L18A L19A L37A (Im7U) in the cell with 1.65 mM Spy dimer in the syringe. (b) Titration of 50 μM Im7-L53A I54A (Im7I) in the cell with 550 μM Spy dimer in the syringe. (c) Titration of 230 μM Im7-WT (Im7N) in the cell with 2.53 mM Spy dimer in the syringe. All titrations were performed in 40 mM HEPES-KOH pH 7.5, 100 mM NaCl at 10 °C. The black lines in the bottom panels are the best fit of the data to a one-site model. Values reported are the mean ± s.e. of the fit.

