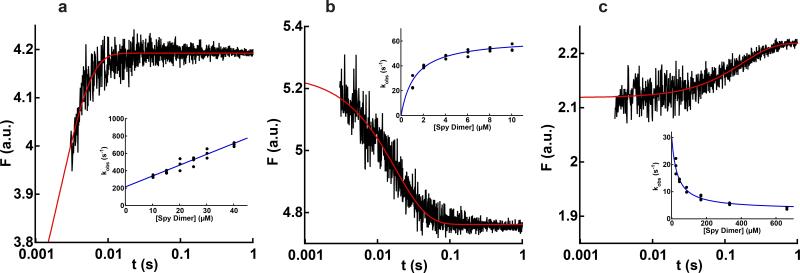
Figure 3.
Kinetics of Spy binding to Im7U, Im7I, and Im7N. Graphs show the change in tryptophan fluorescence (F) associated with Spy binding to (a) 1 μM Im7-L18A L19A L37A (Im7U), (b) 0.5 μM Im7-L53A I54A (Im7I), and (c) 4.8 μM Im7-WT (Im7N). Note the logarithmic timescale. The red lines are the best fit of each data set to a single exponential. The insets show the change in observed rate constant with Spy concentration for each variant of Im7. Each data point in the insets represents the average of 10-15 traces. For Spy binding to Im7-L18A L19A L37A, kobs increased linearly with Spy concentration, indicating that Spy can bind Im7U, and giving kon of 1.3 ± 0.1 × 10⁷ M−1s−1 and koff of 210 ± 20 s−1. For Spy binding to Im7-L53A I54A, kobs increased hyperbolically with Spy concentration, reaching a limiting value of 62 ± 2 s−1, which is consistent with Spy binding Im7I followed by partial folding or unfolding of Im7 within the complex. For Spy binding to Im7-WT, kobs decreased with Spy concentration, reaching a limiting value of 3.3 ± 0.9 s−1. Values reported are the mean ± s.e. of the fit. .In combination with the burst phase when Spy binds Im7-WT (Fig. 4a), this decreasing kobs suggests that Spy can bind Im7N followed by partial unfolding to Im7I while bound.

