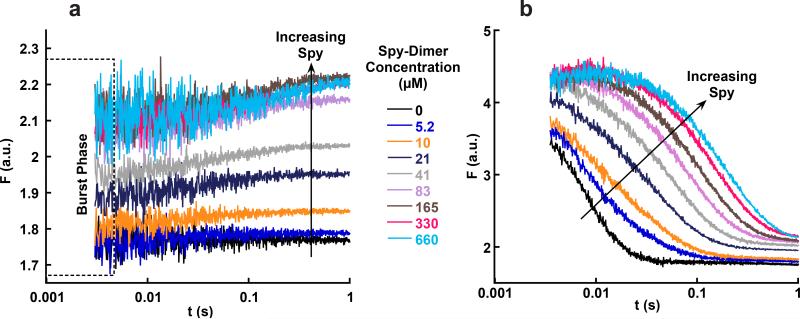
Figure 4.
Stopped-flow fluorescence traces of Spy binding Im7-WT and Im7 folding in the presence of Spy. (a) Traces for Spy binding to Im7-WT under native conditions. The fluorescence of the first data point for each trace is higher than the fluorescence of Im7-WT alone (black trace) and reaches a saturating fluorescence at high Spy concentrations. This burst phase is consistent with Spy binding Im7N within the dead time of the instrument. (b) Traces for Im7-WT folding in the presence of different Spy concentrations. Im7 folding slows as the concentration of Spy is increased. An increase in fluorescence in the first 20 ms occurs in the traces at the highest Spy concentrations; this phase represents the conversion of Im7U to Im7I during Im7 folding that is slowed by Spy. The Spy dimer concentrations used in a and b are identical for each color. Note that the y axes are different in a and b, but that the final fluorescence at 1 s is the same in both experiments, suggesting that the same equilibrium is reached.

