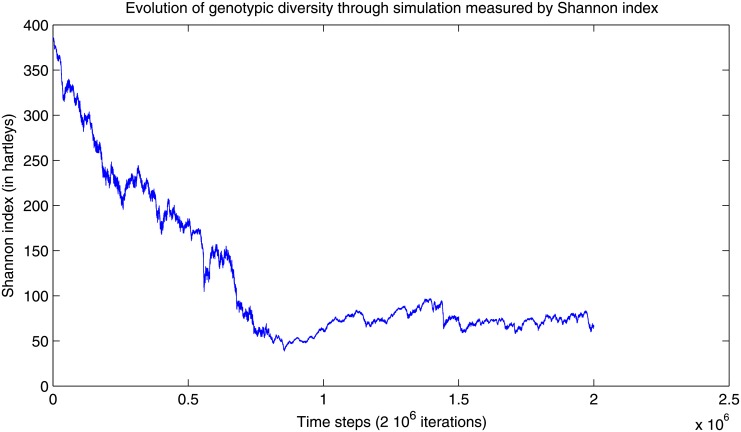
Fig 12. Genotypic diversity measured by Shannon’s information entropy.
The information entropy measures the variety in the measure progressively decreases during the simulation, until it reaches a minimal value of 50 hartleys (information unit corresponding to a base 10 logarithm) around the millionth iteration, then restarts to increase slowly.

