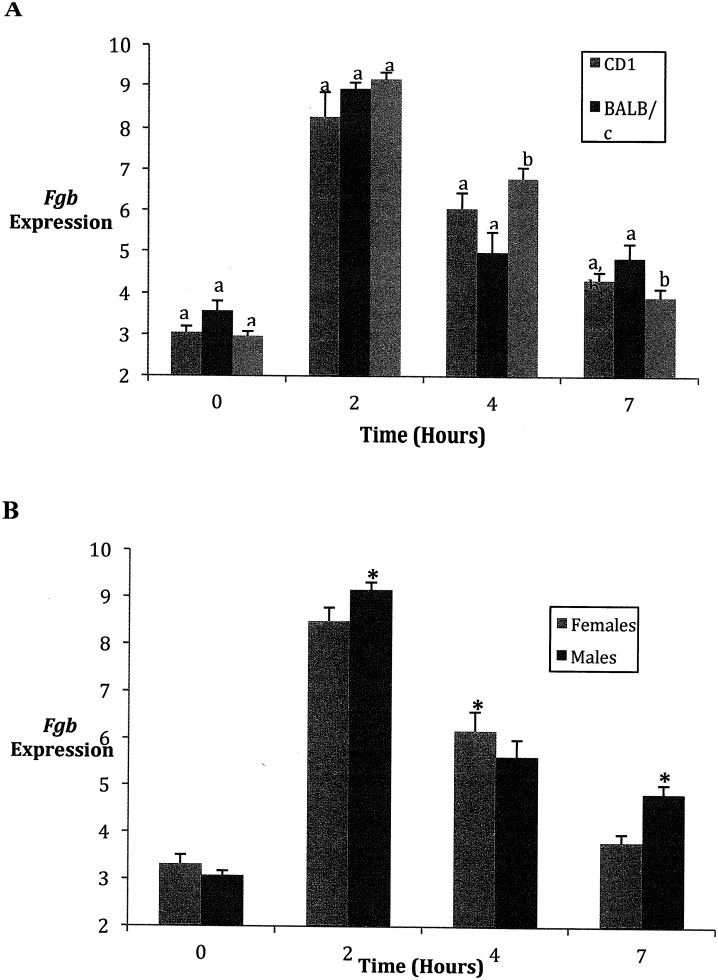
Fig 4. Beta-fibrinogen expression over time in three strains.
Expression of Fgb mRNA as compared to control Actb mRNA following amplification of both genes with quantitative real time PCR. (Mean ± SEM) Fgb data was transformed by raising all values to 0.2. A. There was a significant strain by time interaction (F = 5.55; d.f. = 6, 91; P < 0.0001), with post-hoc tests showing differences in expression levels between BALB/c and B6 mice at 7 hours, and between BL6 and both other strains at 4 hours B. There was also a sex by time interaction (F = 6.73; d.f. = 3, 91; P = 0.0004)), with higher expression levels in males compared with females at the 2 hour and especially the 7 hour time periods, but the reverse at the 4 hour time period. Means with different superscripts are significantly different. P < 0.05.

