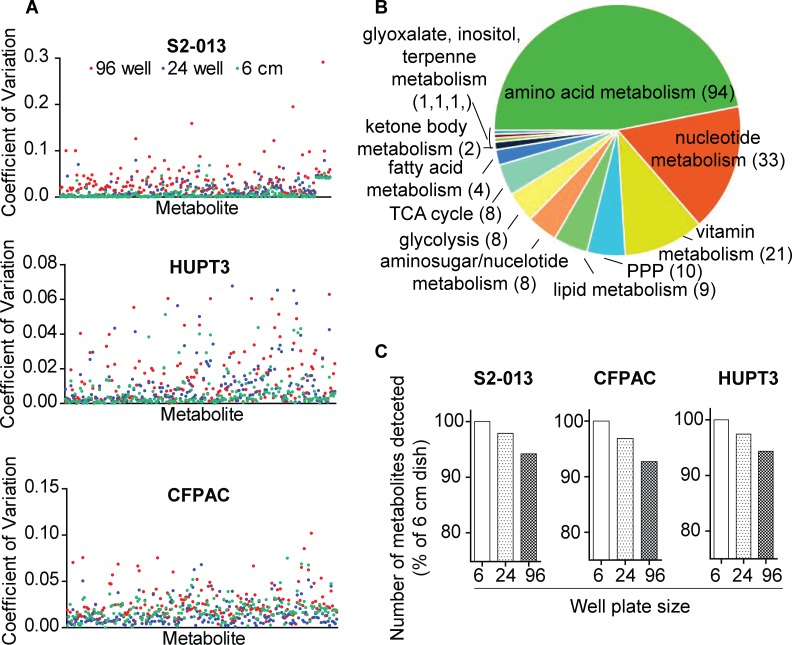
Fig 1. Reproducibility of metabolite detection from microscale cultures.
(A) Scatter plots showing coefficient of variations for individual metabolites detected from 96-, 24-well and 6 cm culture dishes of 3 different pancreatic cancer cell lines. (B) Pie chart showing metabolite abundances corresponding to different metabolic pathways detected in-common from cell lysates. (C) Relative percentage of total number of metabolites detected from three different pancreatic cancer cell lines and three different-sized culture dishes are presented as bar graphs.

