
Figure 3.
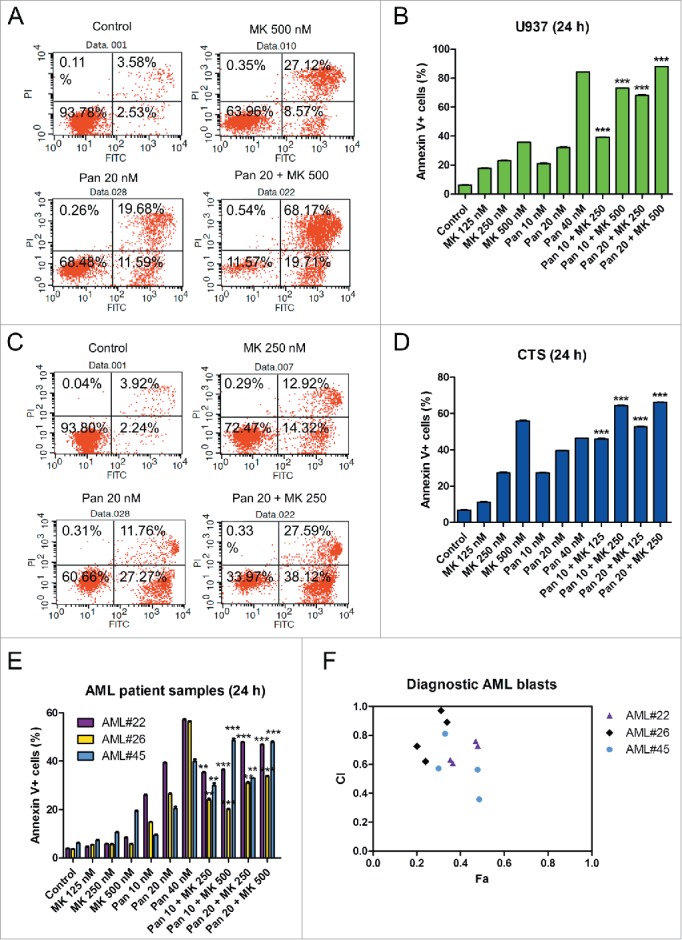
Panobinostat synergizes with MK-1775 to induce cell death in AML cells. Panels A-D: U937 (Panels A and B) and CTS (Panels C and D) cells were treated with the indicated drugs for 24 h. Cell death was determined by annexin V/PI staining and flow cytometry analyses. The experiment was performed at least 3 independent times. Representative annexinV/PI dot plots are shown in Panels A and C. The data are presented as means ± s.e.m of triplicates from one representative experiment (Panels B and D). Statistical significance was calculated using the pair-wise 2-sample t-test. ***indicates p<0.0005. Panel E: Primary patient samples were treated with the indicated drugs for 24 h. Cell death was determined by annexin V/PI staining and flow cytometry analyses. The data are presented as means of triplicates ± s.e.m. from one experiment due to limited sample. Panel F: CI vs. Fa plot (combination index vs. fraction affected) for the data presented in panel E. The CI values were calculated using CompuSyn software.