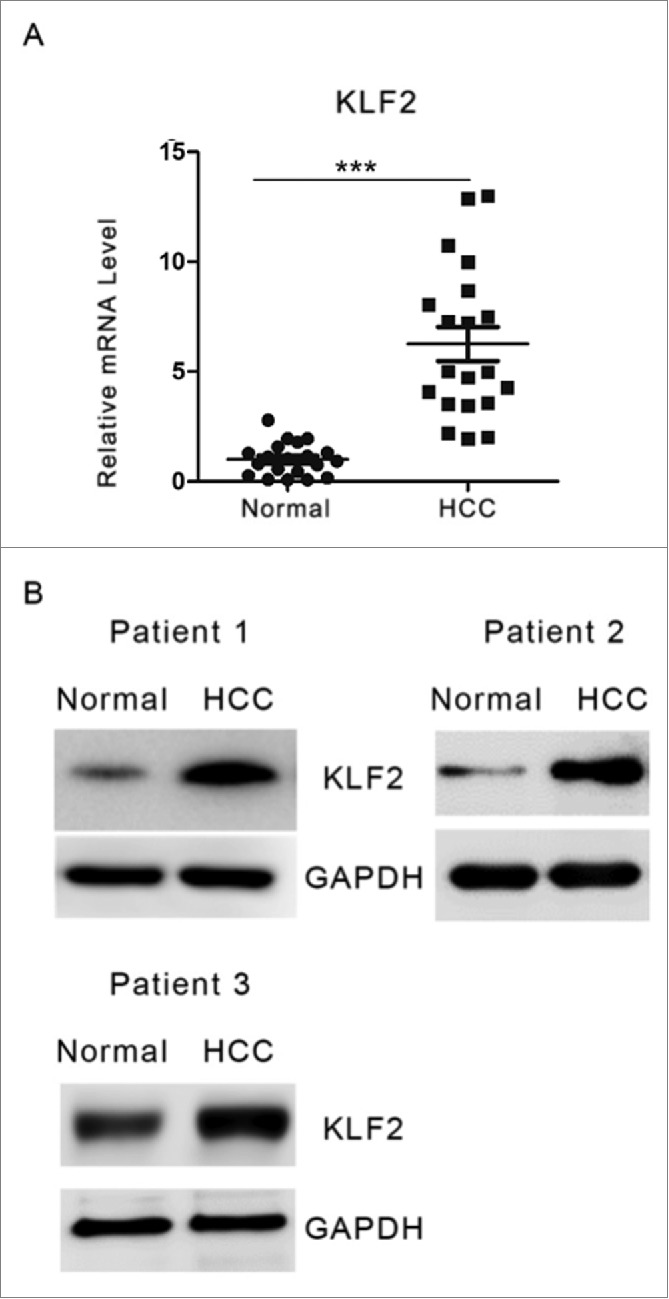
Figure 1.

KLF2 expression in HCC and normal tissues. (A) Relative mRNA levels of KLF2 were determined by quantitative real-time PCR analysis in 60 primary HCC and adjacent normal liver tissues. (B) Representative protein levels of KLF2 in HCC and normal liver tissues from three 3 patients.
