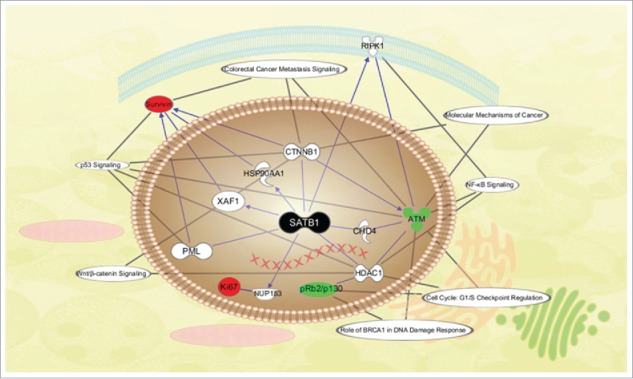
Figure 6.

Schematic diagram of the molecular network of SATB1. Important pathways and cellular localization of proteins were shown. Nodes with different shapes represented the molecular class of proteins and lines represented the relationships between the proteins.
